Basque vs Canadian 4th Grade
COMPARE
Basque
Canadian
4th Grade
4th Grade Comparison
Basques
Canadians
97.8%
4TH GRADE
95.8/ 100
METRIC RATING
113th/ 347
METRIC RANK
98.0%
4TH GRADE
99.6/ 100
METRIC RATING
66th/ 347
METRIC RANK
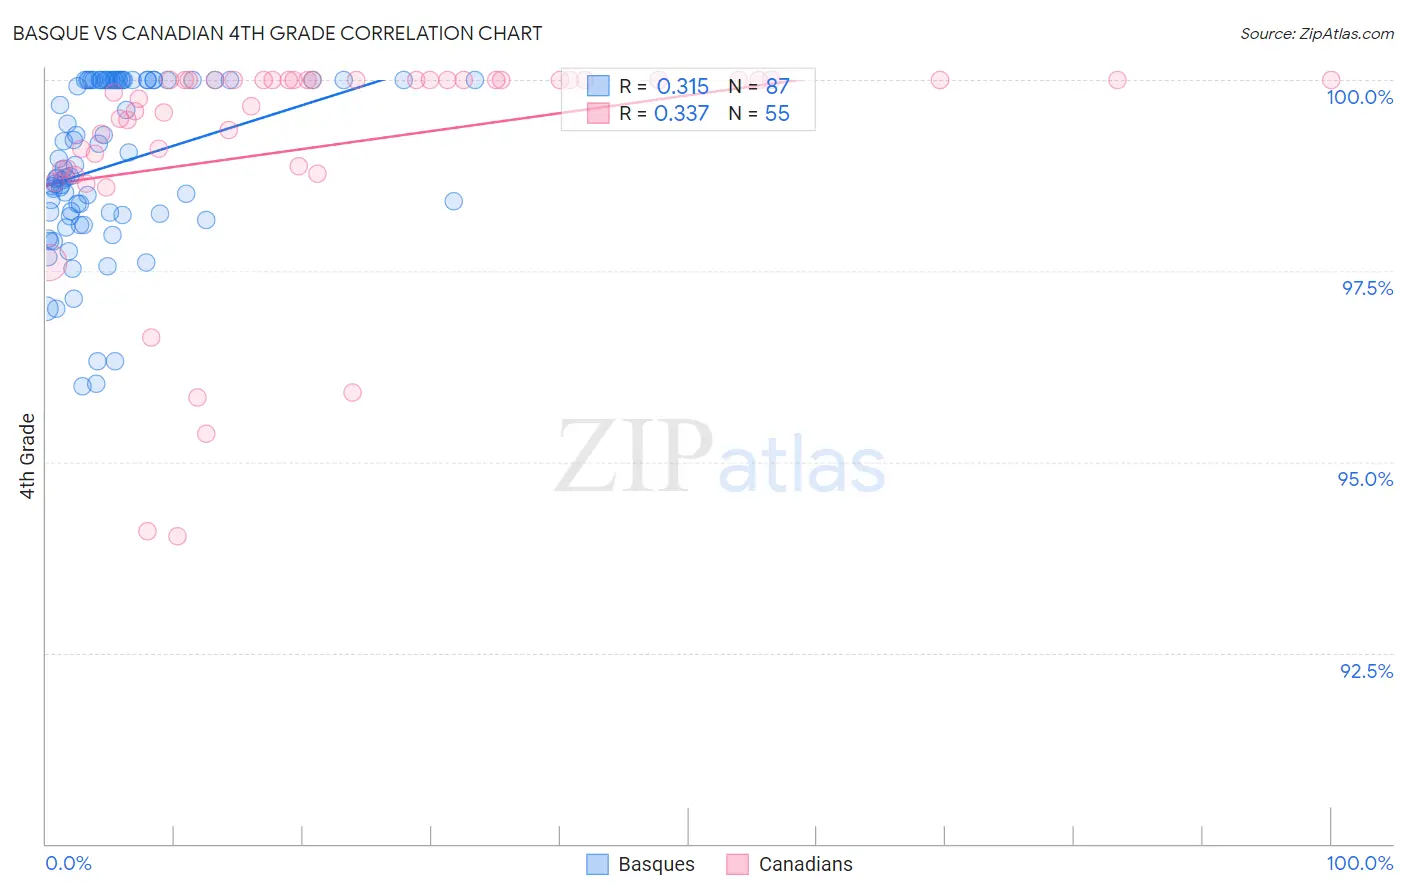
Basque vs Canadian 4th Grade Correlation Chart
The statistical analysis conducted on geographies consisting of 165,774,137 people shows a mild positive correlation between the proportion of Basques and percentage of population with at least 4th grade education in the United States with a correlation coefficient (R) of 0.315 and weighted average of 97.8%. Similarly, the statistical analysis conducted on geographies consisting of 437,557,033 people shows a mild positive correlation between the proportion of Canadians and percentage of population with at least 4th grade education in the United States with a correlation coefficient (R) of 0.337 and weighted average of 98.0%, a difference of 0.23%.
4th Grade Correlation Summary
| Measurement | Basque | Canadian |
| Minimum | 96.0% | 94.0% |
| Maximum | 100.0% | 100.0% |
| Range | 4.0% | 6.0% |
| Mean | 98.9% | 99.1% |
| Median | 98.8% | 100.0% |
| Interquartile 25% (IQ1) | 98.2% | 98.8% |
| Interquartile 75% (IQ3) | 100.0% | 100.0% |
| Interquartile Range (IQR) | 1.8% | 1.2% |
| Standard Deviation (Sample) | 1.1% | 1.5% |
| Standard Deviation (Population) | 1.1% | 1.5% |
Similar Demographics by 4th Grade
Demographics Similar to Basques by 4th Grade
In terms of 4th grade, the demographic groups most similar to Basques are Okinawan (97.8%, a difference of 0.0%), Immigrants from Switzerland (97.8%, a difference of 0.010%), Iroquois (97.8%, a difference of 0.010%), Lebanese (97.8%, a difference of 0.010%), and Immigrants from Croatia (97.8%, a difference of 0.010%).
| Demographics | Rating | Rank | 4th Grade |
| Immigrants | Czechoslovakia | 97.5 /100 | #106 | Exceptional 97.9% |
| Bhutanese | 97.4 /100 | #107 | Exceptional 97.9% |
| Immigrants | Singapore | 97.3 /100 | #108 | Exceptional 97.9% |
| Immigrants | Latvia | 96.8 /100 | #109 | Exceptional 97.8% |
| Thais | 96.7 /100 | #110 | Exceptional 97.8% |
| Immigrants | Switzerland | 96.1 /100 | #111 | Exceptional 97.8% |
| Okinawans | 96.0 /100 | #112 | Exceptional 97.8% |
| Basques | 95.8 /100 | #113 | Exceptional 97.8% |
| Iroquois | 95.4 /100 | #114 | Exceptional 97.8% |
| Lebanese | 95.4 /100 | #115 | Exceptional 97.8% |
| Immigrants | Croatia | 95.2 /100 | #116 | Exceptional 97.8% |
| Syrians | 94.9 /100 | #117 | Exceptional 97.8% |
| Menominee | 94.9 /100 | #118 | Exceptional 97.8% |
| Immigrants | Saudi Arabia | 94.8 /100 | #119 | Exceptional 97.8% |
| Immigrants | France | 94.8 /100 | #120 | Exceptional 97.8% |
Demographics Similar to Canadians by 4th Grade
In terms of 4th grade, the demographic groups most similar to Canadians are Immigrants from Northern Europe (98.0%, a difference of 0.0%), New Zealander (98.0%, a difference of 0.0%), Russian (98.0%, a difference of 0.010%), Cajun (98.0%, a difference of 0.010%), and Kiowa (98.0%, a difference of 0.010%).
| Demographics | Rating | Rank | 4th Grade |
| Americans | 99.8 /100 | #59 | Exceptional 98.1% |
| Immigrants | Canada | 99.7 /100 | #60 | Exceptional 98.1% |
| Immigrants | North America | 99.7 /100 | #61 | Exceptional 98.1% |
| Serbians | 99.7 /100 | #62 | Exceptional 98.1% |
| Russians | 99.7 /100 | #63 | Exceptional 98.0% |
| Cajuns | 99.7 /100 | #64 | Exceptional 98.0% |
| Immigrants | Northern Europe | 99.6 /100 | #65 | Exceptional 98.0% |
| Canadians | 99.6 /100 | #66 | Exceptional 98.0% |
| New Zealanders | 99.6 /100 | #67 | Exceptional 98.0% |
| Kiowa | 99.6 /100 | #68 | Exceptional 98.0% |
| Pueblo | 99.6 /100 | #69 | Exceptional 98.0% |
| Immigrants | Austria | 99.6 /100 | #70 | Exceptional 98.0% |
| Lumbee | 99.6 /100 | #71 | Exceptional 98.0% |
| Iranians | 99.4 /100 | #72 | Exceptional 98.0% |
| Macedonians | 99.4 /100 | #73 | Exceptional 98.0% |