Basque vs Canadian Unemployment Among Ages 35 to 44 years
COMPARE
Basque
Canadian
Unemployment Among Ages 35 to 44 years
Unemployment Among Ages 35 to 44 years Comparison
Basques
Canadians
4.5%
UNEMPLOYMENT AMONG AGES 35 TO 44 YEARS
86.3/ 100
METRIC RATING
123rd/ 347
METRIC RANK
4.6%
UNEMPLOYMENT AMONG AGES 35 TO 44 YEARS
75.9/ 100
METRIC RATING
141st/ 347
METRIC RANK
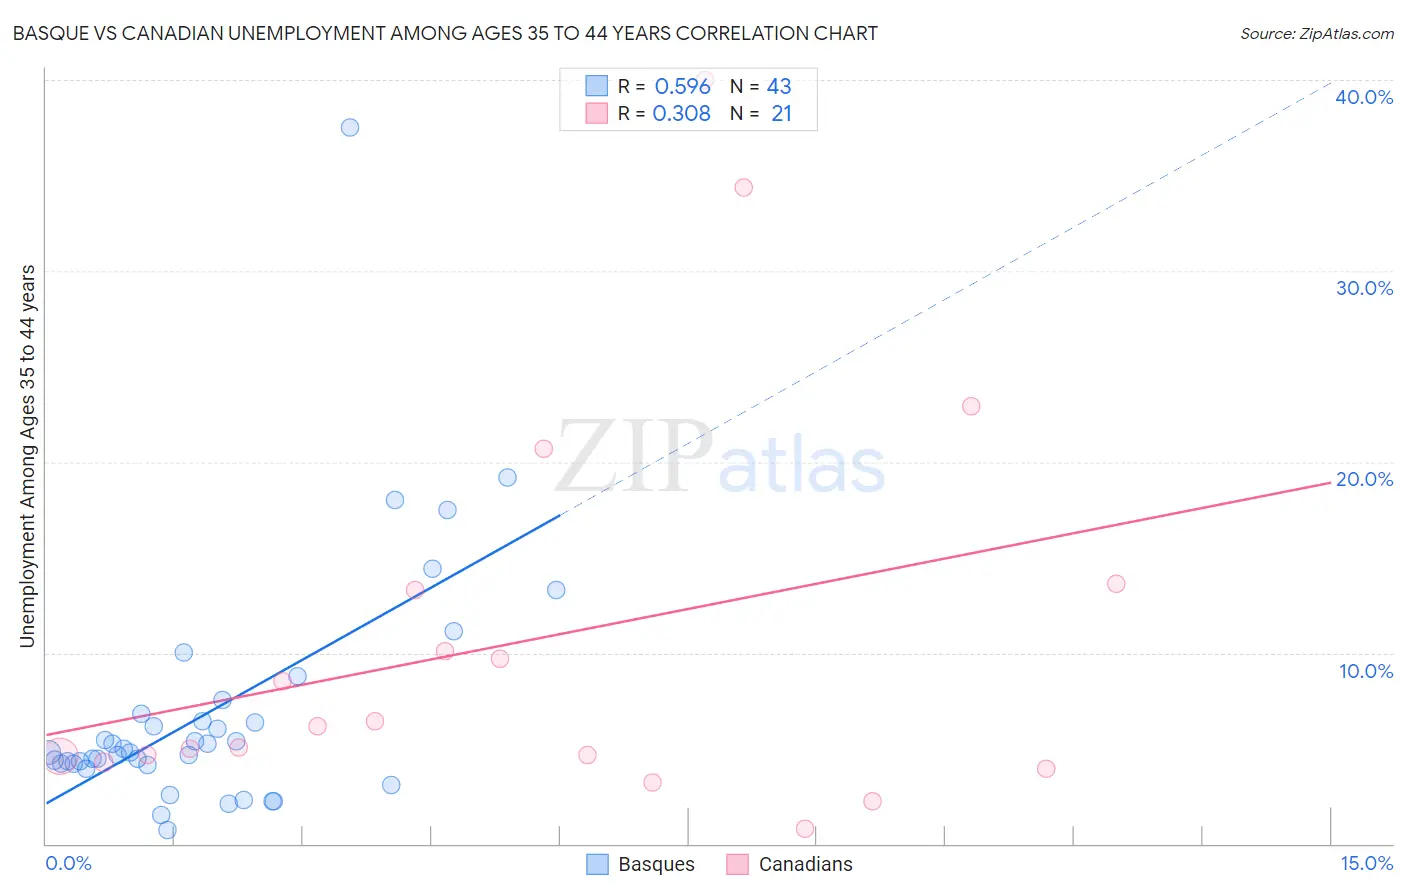
Basque vs Canadian Unemployment Among Ages 35 to 44 years Correlation Chart
The statistical analysis conducted on geographies consisting of 164,256,495 people shows a substantial positive correlation between the proportion of Basques and unemployment rate among population between the ages 35 and 44 in the United States with a correlation coefficient (R) of 0.596 and weighted average of 4.5%. Similarly, the statistical analysis conducted on geographies consisting of 422,895,705 people shows a mild positive correlation between the proportion of Canadians and unemployment rate among population between the ages 35 and 44 in the United States with a correlation coefficient (R) of 0.308 and weighted average of 4.6%, a difference of 1.3%.
Unemployment Among Ages 35 to 44 years Correlation Summary
| Measurement | Basque | Canadian |
| Minimum | 0.70% | 0.80% |
| Maximum | 37.5% | 40.0% |
| Range | 36.8% | 39.2% |
| Mean | 7.0% | 10.7% |
| Median | 4.8% | 6.1% |
| Interquartile 25% (IQ1) | 4.2% | 4.4% |
| Interquartile 75% (IQ3) | 6.8% | 13.5% |
| Interquartile Range (IQR) | 2.6% | 9.0% |
| Standard Deviation (Sample) | 6.4% | 10.5% |
| Standard Deviation (Population) | 6.4% | 10.3% |
Demographics Similar to Basques and Canadians by Unemployment Among Ages 35 to 44 years
In terms of unemployment among ages 35 to 44 years, the demographic groups most similar to Basques are Immigrants from Spain (4.5%, a difference of 0.030%), Immigrants from Northern Africa (4.5%, a difference of 0.030%), Sri Lankan (4.5%, a difference of 0.080%), Immigrants from Austria (4.5%, a difference of 0.23%), and Immigrants from Ethiopia (4.5%, a difference of 0.24%). Similarly, the demographic groups most similar to Canadians are Immigrants from Eastern Africa (4.6%, a difference of 0.010%), Ukrainian (4.6%, a difference of 0.010%), Immigrants from Hungary (4.6%, a difference of 0.030%), Immigrants from Norway (4.6%, a difference of 0.16%), and Immigrants from Iraq (4.6%, a difference of 0.31%).
| Demographics | Rating | Rank | Unemployment Among Ages 35 to 44 years |
| Sri Lankans | 86.8 /100 | #122 | Excellent 4.5% |
| Basques | 86.3 /100 | #123 | Excellent 4.5% |
| Immigrants | Spain | 86.1 /100 | #124 | Excellent 4.5% |
| Immigrants | Northern Africa | 86.1 /100 | #125 | Excellent 4.5% |
| Immigrants | Austria | 84.7 /100 | #126 | Excellent 4.5% |
| Immigrants | Ethiopia | 84.7 /100 | #127 | Excellent 4.5% |
| Czechoslovakians | 83.4 /100 | #128 | Excellent 4.6% |
| Immigrants | Croatia | 83.1 /100 | #129 | Excellent 4.6% |
| Immigrants | Eritrea | 82.8 /100 | #130 | Excellent 4.6% |
| Immigrants | Colombia | 82.6 /100 | #131 | Excellent 4.6% |
| Colombians | 80.8 /100 | #132 | Excellent 4.6% |
| Syrians | 80.7 /100 | #133 | Excellent 4.6% |
| Laotians | 80.1 /100 | #134 | Excellent 4.6% |
| Immigrants | Europe | 79.4 /100 | #135 | Good 4.6% |
| Scotch-Irish | 79.3 /100 | #136 | Good 4.6% |
| Immigrants | Iraq | 78.9 /100 | #137 | Good 4.6% |
| Immigrants | Norway | 77.5 /100 | #138 | Good 4.6% |
| Immigrants | Hungary | 76.3 /100 | #139 | Good 4.6% |
| Immigrants | Eastern Africa | 76.0 /100 | #140 | Good 4.6% |
| Canadians | 75.9 /100 | #141 | Good 4.6% |
| Ukrainians | 75.8 /100 | #142 | Good 4.6% |