Basque vs Canadian Seniors Poverty Over the Age of 75
COMPARE
Basque
Canadian
Seniors Poverty Over the Age of 75
Seniors Poverty Over the Age of 75 Comparison
Basques
Canadians
11.5%
SENIORS POVERTY OVER THE AGE OF 75
95.1/ 100
METRIC RATING
81st/ 347
METRIC RANK
11.3%
SENIORS POVERTY OVER THE AGE OF 75
97.7/ 100
METRIC RATING
61st/ 347
METRIC RANK
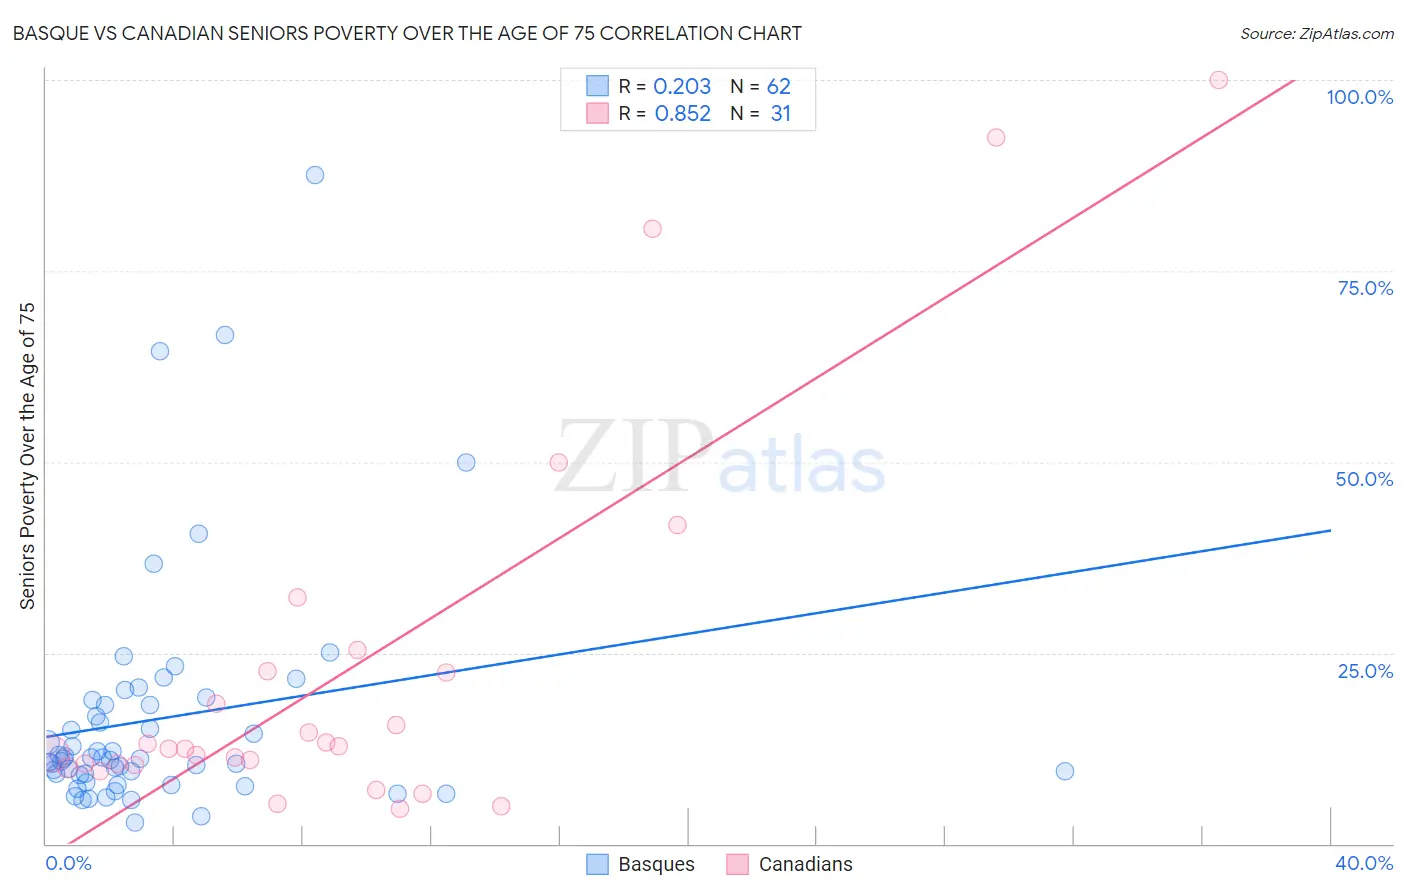
Basque vs Canadian Seniors Poverty Over the Age of 75 Correlation Chart
The statistical analysis conducted on geographies consisting of 164,990,865 people shows a weak positive correlation between the proportion of Basques and poverty level among seniors over the age of 75 in the United States with a correlation coefficient (R) of 0.203 and weighted average of 11.5%. Similarly, the statistical analysis conducted on geographies consisting of 430,823,365 people shows a very strong positive correlation between the proportion of Canadians and poverty level among seniors over the age of 75 in the United States with a correlation coefficient (R) of 0.852 and weighted average of 11.3%, a difference of 1.7%.
Seniors Poverty Over the Age of 75 Correlation Summary
| Measurement | Basque | Canadian |
| Minimum | 2.7% | 4.7% |
| Maximum | 87.5% | 100.0% |
| Range | 84.8% | 95.3% |
| Mean | 16.4% | 22.7% |
| Median | 11.1% | 12.5% |
| Interquartile 25% (IQ1) | 9.1% | 10.3% |
| Interquartile 75% (IQ3) | 18.2% | 22.6% |
| Interquartile Range (IQR) | 9.1% | 12.3% |
| Standard Deviation (Sample) | 15.5% | 25.0% |
| Standard Deviation (Population) | 15.4% | 24.6% |
Demographics Similar to Basques and Canadians by Seniors Poverty Over the Age of 75
In terms of seniors poverty over the age of 75, the demographic groups most similar to Basques are Alaska Native (11.4%, a difference of 0.12%), Filipino (11.4%, a difference of 0.17%), Macedonian (11.4%, a difference of 0.18%), White/Caucasian (11.4%, a difference of 0.19%), and French Canadian (11.4%, a difference of 0.27%). Similarly, the demographic groups most similar to Canadians are Immigrants from North America (11.3%, a difference of 0.10%), Immigrants from Afghanistan (11.3%, a difference of 0.14%), Immigrants from Northern Europe (11.3%, a difference of 0.28%), Immigrants from Taiwan (11.4%, a difference of 0.78%), and Estonian (11.4%, a difference of 0.81%).
| Demographics | Rating | Rank | Seniors Poverty Over the Age of 75 |
| Canadians | 97.7 /100 | #61 | Exceptional 11.3% |
| Immigrants | North America | 97.6 /100 | #62 | Exceptional 11.3% |
| Immigrants | Afghanistan | 97.5 /100 | #63 | Exceptional 11.3% |
| Immigrants | Northern Europe | 97.4 /100 | #64 | Exceptional 11.3% |
| Immigrants | Taiwan | 96.7 /100 | #65 | Exceptional 11.4% |
| Estonians | 96.7 /100 | #66 | Exceptional 11.4% |
| Bolivians | 96.5 /100 | #67 | Exceptional 11.4% |
| Immigrants | Austria | 96.5 /100 | #68 | Exceptional 11.4% |
| Ottawa | 96.5 /100 | #69 | Exceptional 11.4% |
| Immigrants | South Central Asia | 96.4 /100 | #70 | Exceptional 11.4% |
| Osage | 96.3 /100 | #71 | Exceptional 11.4% |
| Sierra Leoneans | 96.1 /100 | #72 | Exceptional 11.4% |
| Immigrants | Micronesia | 96.0 /100 | #73 | Exceptional 11.4% |
| Delaware | 96.0 /100 | #74 | Exceptional 11.4% |
| Palestinians | 95.8 /100 | #75 | Exceptional 11.4% |
| French Canadians | 95.7 /100 | #76 | Exceptional 11.4% |
| Whites/Caucasians | 95.5 /100 | #77 | Exceptional 11.4% |
| Macedonians | 95.5 /100 | #78 | Exceptional 11.4% |
| Filipinos | 95.5 /100 | #79 | Exceptional 11.4% |
| Alaska Natives | 95.4 /100 | #80 | Exceptional 11.4% |
| Basques | 95.1 /100 | #81 | Exceptional 11.5% |