Cambodian vs Canadian In Labor Force | Age 30-34
COMPARE
Cambodian
Canadian
In Labor Force | Age 30-34
In Labor Force | Age 30-34 Comparison
Cambodians
Canadians
86.2%
IN LABOR FORCE | AGE 30-34
100.0/ 100
METRIC RATING
8th/ 347
METRIC RANK
84.4%
IN LABOR FORCE | AGE 30-34
15.4/ 100
METRIC RATING
203rd/ 347
METRIC RANK
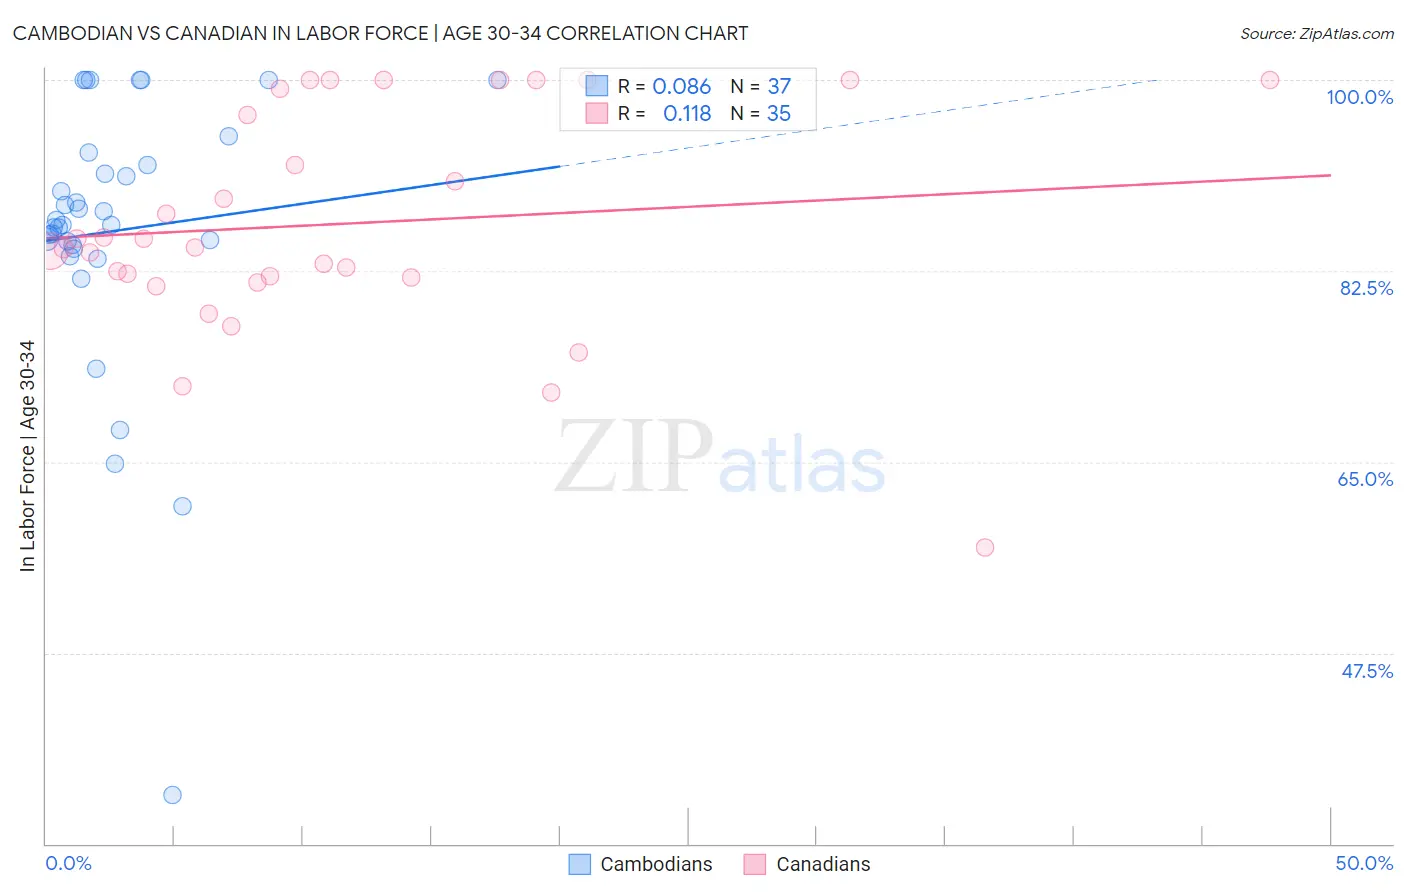
Cambodian vs Canadian In Labor Force | Age 30-34 Correlation Chart
The statistical analysis conducted on geographies consisting of 102,502,292 people shows a slight positive correlation between the proportion of Cambodians and labor force participation rate among population between the ages 30 and 34 in the United States with a correlation coefficient (R) of 0.086 and weighted average of 86.2%. Similarly, the statistical analysis conducted on geographies consisting of 437,189,359 people shows a poor positive correlation between the proportion of Canadians and labor force participation rate among population between the ages 30 and 34 in the United States with a correlation coefficient (R) of 0.118 and weighted average of 84.4%, a difference of 2.1%.
In Labor Force | Age 30-34 Correlation Summary
| Measurement | Cambodian | Canadian |
| Minimum | 34.5% | 57.1% |
| Maximum | 100.0% | 100.0% |
| Range | 65.5% | 42.9% |
| Mean | 86.2% | 86.8% |
| Median | 86.8% | 84.6% |
| Interquartile 25% (IQ1) | 84.7% | 81.9% |
| Interquartile 75% (IQ3) | 92.8% | 99.2% |
| Interquartile Range (IQR) | 8.1% | 17.3% |
| Standard Deviation (Sample) | 12.8% | 10.2% |
| Standard Deviation (Population) | 12.6% | 10.1% |
Similar Demographics by In Labor Force | Age 30-34
Demographics Similar to Cambodians by In Labor Force | Age 30-34
In terms of in labor force | age 30-34, the demographic groups most similar to Cambodians are Immigrants from Bolivia (86.2%, a difference of 0.010%), Immigrants from Somalia (86.2%, a difference of 0.010%), Somali (86.2%, a difference of 0.020%), Immigrants from Serbia (86.2%, a difference of 0.050%), and Immigrants from Ireland (86.3%, a difference of 0.060%).
| Demographics | Rating | Rank | In Labor Force | Age 30-34 |
| Luxembourgers | 100.0 /100 | #1 | Exceptional 86.6% |
| Ethiopians | 100.0 /100 | #2 | Exceptional 86.6% |
| Immigrants | Ethiopia | 100.0 /100 | #3 | Exceptional 86.6% |
| Liberians | 100.0 /100 | #4 | Exceptional 86.4% |
| Immigrants | Ireland | 100.0 /100 | #5 | Exceptional 86.3% |
| Somalis | 100.0 /100 | #6 | Exceptional 86.2% |
| Immigrants | Bolivia | 100.0 /100 | #7 | Exceptional 86.2% |
| Cambodians | 100.0 /100 | #8 | Exceptional 86.2% |
| Immigrants | Somalia | 100.0 /100 | #9 | Exceptional 86.2% |
| Immigrants | Serbia | 100.0 /100 | #10 | Exceptional 86.2% |
| Carpatho Rusyns | 100.0 /100 | #11 | Exceptional 86.2% |
| Bolivians | 100.0 /100 | #12 | Exceptional 86.1% |
| Immigrants | Croatia | 100.0 /100 | #13 | Exceptional 86.1% |
| Immigrants | Cabo Verde | 100.0 /100 | #14 | Exceptional 86.1% |
| Immigrants | Albania | 100.0 /100 | #15 | Exceptional 86.1% |
Demographics Similar to Canadians by In Labor Force | Age 30-34
In terms of in labor force | age 30-34, the demographic groups most similar to Canadians are Ecuadorian (84.4%, a difference of 0.020%), French (84.4%, a difference of 0.020%), Trinidadian and Tobagonian (84.5%, a difference of 0.030%), Immigrants from West Indies (84.5%, a difference of 0.030%), and Subsaharan African (84.5%, a difference of 0.040%).
| Demographics | Rating | Rank | In Labor Force | Age 30-34 |
| British | 22.9 /100 | #196 | Fair 84.5% |
| Immigrants | Syria | 21.9 /100 | #197 | Fair 84.5% |
| Dutch | 20.2 /100 | #198 | Fair 84.5% |
| Immigrants | Thailand | 19.1 /100 | #199 | Poor 84.5% |
| Sub-Saharan Africans | 19.0 /100 | #200 | Poor 84.5% |
| Trinidadians and Tobagonians | 18.2 /100 | #201 | Poor 84.5% |
| Immigrants | West Indies | 18.1 /100 | #202 | Poor 84.5% |
| Canadians | 15.4 /100 | #203 | Poor 84.4% |
| Ecuadorians | 14.2 /100 | #204 | Poor 84.4% |
| French | 13.8 /100 | #205 | Poor 84.4% |
| Lebanese | 10.6 /100 | #206 | Poor 84.4% |
| Bangladeshis | 9.4 /100 | #207 | Tragic 84.3% |
| Arabs | 8.9 /100 | #208 | Tragic 84.3% |
| Jamaicans | 8.8 /100 | #209 | Tragic 84.3% |
| Indonesians | 8.8 /100 | #210 | Tragic 84.3% |