Bahamian vs Puerto Rican In Labor Force | Age 16-19
COMPARE
Bahamian
Puerto Rican
In Labor Force | Age 16-19
In Labor Force | Age 16-19 Comparison
Bahamians
Puerto Ricans
34.6%
IN LABOR FORCE | AGE 16-19
1.4/ 100
METRIC RATING
254th/ 347
METRIC RANK
30.3%
IN LABOR FORCE | AGE 16-19
0.0/ 100
METRIC RATING
334th/ 347
METRIC RANK
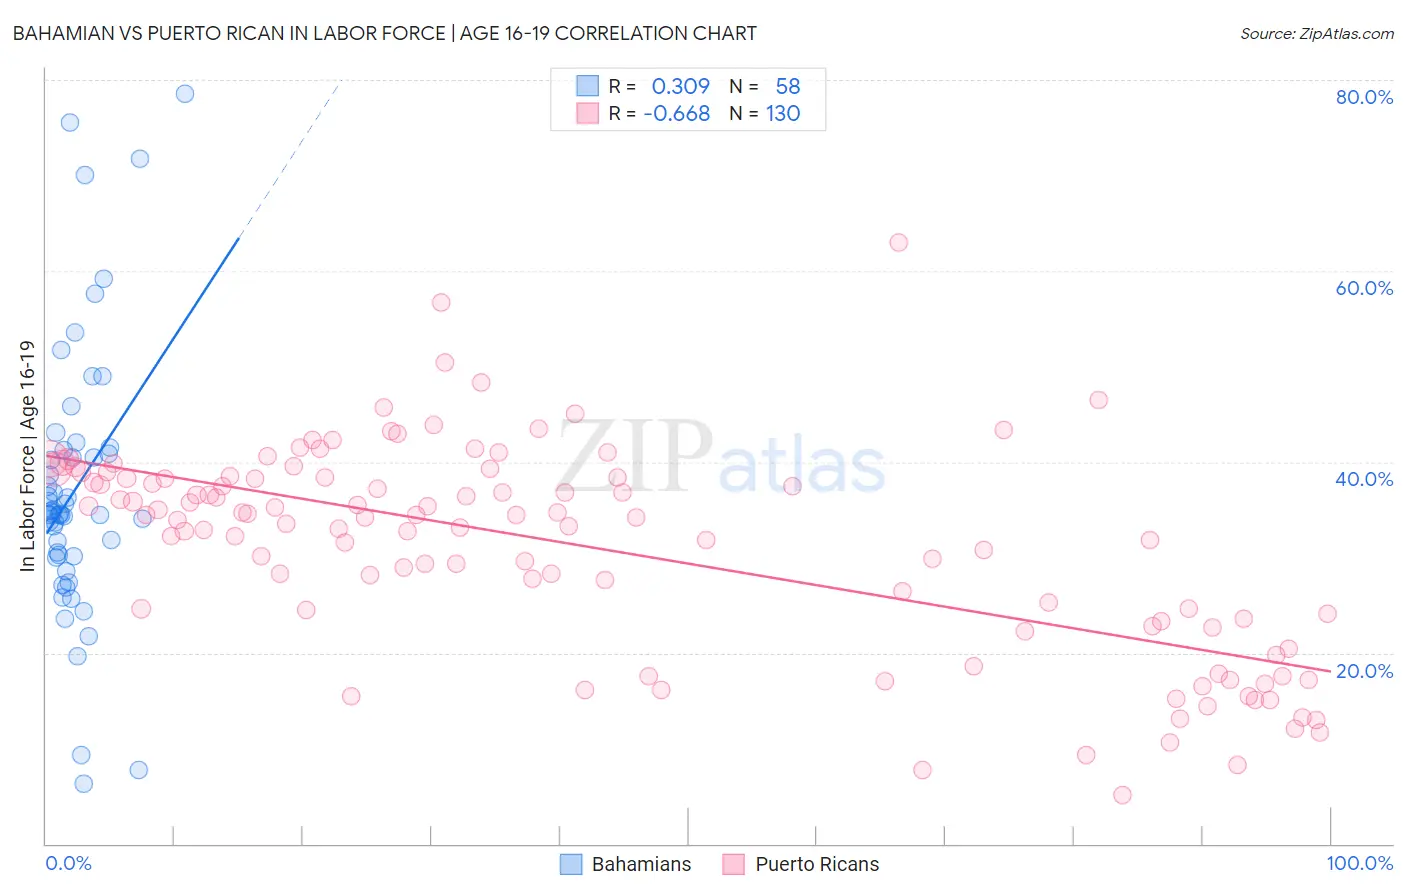
Bahamian vs Puerto Rican In Labor Force | Age 16-19 Correlation Chart
The statistical analysis conducted on geographies consisting of 112,651,679 people shows a mild positive correlation between the proportion of Bahamians and labor force participation rate among population between the ages 16 and 19 in the United States with a correlation coefficient (R) of 0.309 and weighted average of 34.6%. Similarly, the statistical analysis conducted on geographies consisting of 526,303,316 people shows a significant negative correlation between the proportion of Puerto Ricans and labor force participation rate among population between the ages 16 and 19 in the United States with a correlation coefficient (R) of -0.668 and weighted average of 30.3%, a difference of 14.1%.
In Labor Force | Age 16-19 Correlation Summary
| Measurement | Bahamian | Puerto Rican |
| Minimum | 6.3% | 5.1% |
| Maximum | 78.5% | 63.0% |
| Range | 72.2% | 57.9% |
| Mean | 37.1% | 31.0% |
| Median | 34.6% | 34.0% |
| Interquartile 25% (IQ1) | 30.1% | 23.4% |
| Interquartile 75% (IQ3) | 41.2% | 38.3% |
| Interquartile Range (IQR) | 11.1% | 14.9% |
| Standard Deviation (Sample) | 14.4% | 10.9% |
| Standard Deviation (Population) | 14.3% | 10.8% |
Similar Demographics by In Labor Force | Age 16-19
Demographics Similar to Bahamians by In Labor Force | Age 16-19
In terms of in labor force | age 16-19, the demographic groups most similar to Bahamians are Peruvian (34.6%, a difference of 0.040%), Immigrants from Japan (34.7%, a difference of 0.12%), Immigrants from South Central Asia (34.6%, a difference of 0.15%), Immigrants from Egypt (34.6%, a difference of 0.15%), and Thai (34.6%, a difference of 0.16%).
| Demographics | Rating | Rank | In Labor Force | Age 16-19 |
| Laotians | 2.4 /100 | #247 | Tragic 34.9% |
| Central Americans | 2.2 /100 | #248 | Tragic 34.8% |
| Immigrants | Ukraine | 2.2 /100 | #249 | Tragic 34.8% |
| Immigrants | Pakistan | 2.0 /100 | #250 | Tragic 34.8% |
| Immigrants | Western Asia | 2.0 /100 | #251 | Tragic 34.8% |
| Immigrants | Chile | 2.0 /100 | #252 | Tragic 34.8% |
| Immigrants | Japan | 1.5 /100 | #253 | Tragic 34.7% |
| Bahamians | 1.4 /100 | #254 | Tragic 34.6% |
| Peruvians | 1.4 /100 | #255 | Tragic 34.6% |
| Immigrants | South Central Asia | 1.3 /100 | #256 | Tragic 34.6% |
| Immigrants | Egypt | 1.2 /100 | #257 | Tragic 34.6% |
| Thais | 1.2 /100 | #258 | Tragic 34.6% |
| Immigrants | Immigrants | 1.2 /100 | #259 | Tragic 34.6% |
| Egyptians | 1.2 /100 | #260 | Tragic 34.5% |
| Salvadorans | 1.1 /100 | #261 | Tragic 34.5% |
Demographics Similar to Puerto Ricans by In Labor Force | Age 16-19
In terms of in labor force | age 16-19, the demographic groups most similar to Puerto Ricans are Immigrants from Cuba (30.2%, a difference of 0.33%), Immigrants from Hong Kong (30.5%, a difference of 0.42%), Immigrants from Israel (30.5%, a difference of 0.44%), Immigrants from Trinidad and Tobago (30.2%, a difference of 0.62%), and Immigrants from Bangladesh (30.0%, a difference of 0.99%).
| Demographics | Rating | Rank | In Labor Force | Age 16-19 |
| Immigrants | Taiwan | 0.0 /100 | #327 | Tragic 31.0% |
| Immigrants | Ecuador | 0.0 /100 | #328 | Tragic 31.0% |
| Barbadians | 0.0 /100 | #329 | Tragic 31.0% |
| Lumbee | 0.0 /100 | #330 | Tragic 31.0% |
| Trinidadians and Tobagonians | 0.0 /100 | #331 | Tragic 30.9% |
| Immigrants | Israel | 0.0 /100 | #332 | Tragic 30.5% |
| Immigrants | Hong Kong | 0.0 /100 | #333 | Tragic 30.5% |
| Puerto Ricans | 0.0 /100 | #334 | Tragic 30.3% |
| Immigrants | Cuba | 0.0 /100 | #335 | Tragic 30.2% |
| Immigrants | Trinidad and Tobago | 0.0 /100 | #336 | Tragic 30.2% |
| Immigrants | Bangladesh | 0.0 /100 | #337 | Tragic 30.0% |
| Vietnamese | 0.0 /100 | #338 | Tragic 29.6% |
| Immigrants | Uzbekistan | 0.0 /100 | #339 | Tragic 29.2% |
| British West Indians | 0.0 /100 | #340 | Tragic 29.1% |
| Immigrants | Armenia | 0.0 /100 | #341 | Tragic 29.0% |