Immigrants from Hong Kong vs Pueblo In Labor Force | Age 20-24
COMPARE
Immigrants from Hong Kong
Pueblo
In Labor Force | Age 20-24
In Labor Force | Age 20-24 Comparison
Immigrants from Hong Kong
Pueblo
71.6%
IN LABOR FORCE | AGE 20-24
0.0/ 100
METRIC RATING
318th/ 347
METRIC RANK
72.9%
IN LABOR FORCE | AGE 20-24
0.0/ 100
METRIC RATING
292nd/ 347
METRIC RANK
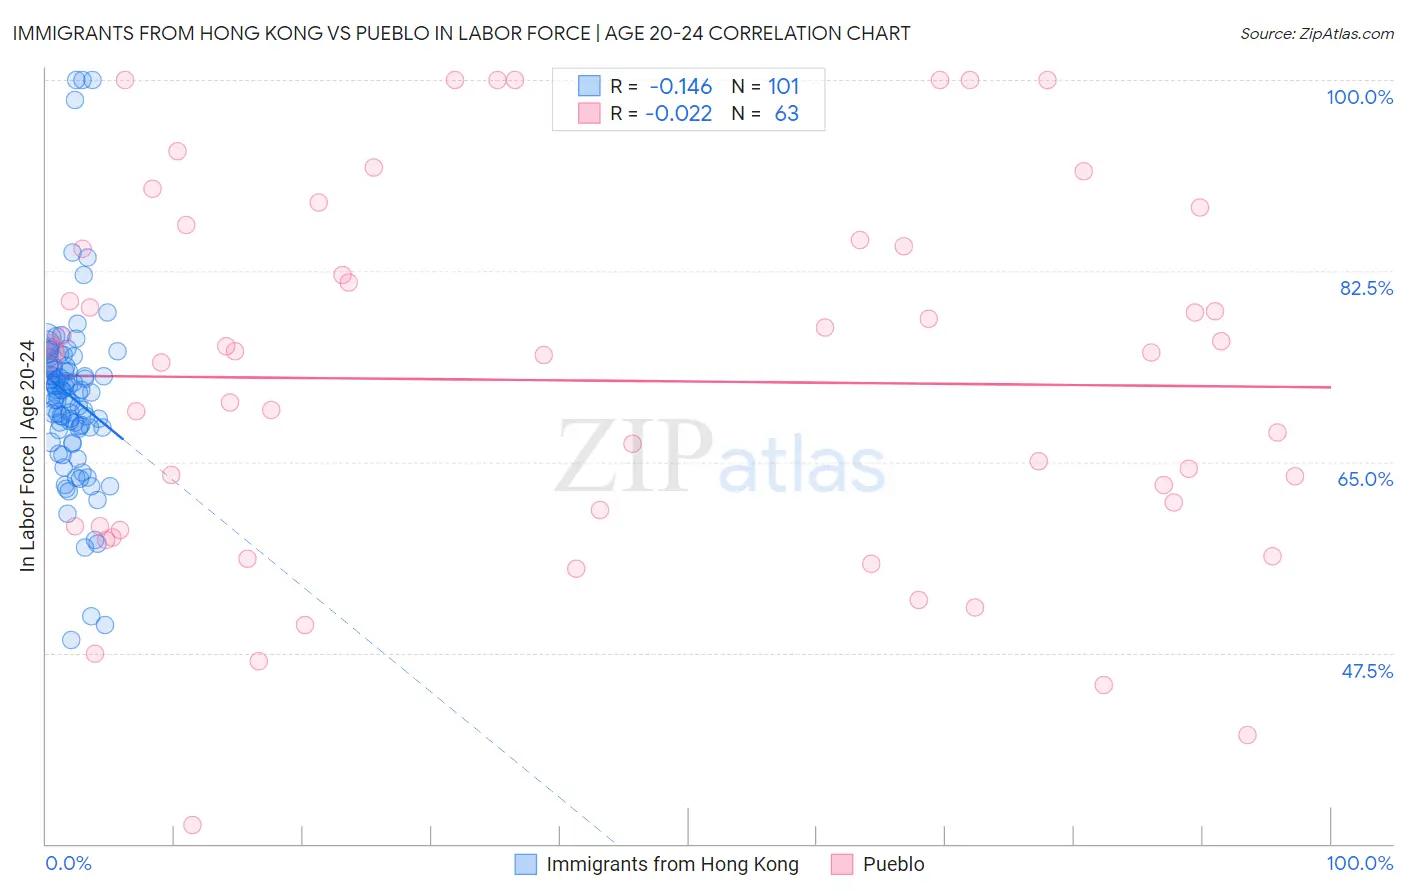
Immigrants from Hong Kong vs Pueblo In Labor Force | Age 20-24 Correlation Chart
The statistical analysis conducted on geographies consisting of 253,918,765 people shows a poor negative correlation between the proportion of Immigrants from Hong Kong and labor force participation rate among population between the ages 20 and 24 in the United States with a correlation coefficient (R) of -0.146 and weighted average of 71.6%. Similarly, the statistical analysis conducted on geographies consisting of 120,061,878 people shows no correlation between the proportion of Pueblo and labor force participation rate among population between the ages 20 and 24 in the United States with a correlation coefficient (R) of -0.022 and weighted average of 72.9%, a difference of 1.8%.
In Labor Force | Age 20-24 Correlation Summary
| Measurement | Immigrants from Hong Kong | Pueblo |
| Minimum | 48.7% | 31.7% |
| Maximum | 100.0% | 100.0% |
| Range | 51.3% | 68.3% |
| Mean | 71.0% | 72.5% |
| Median | 71.4% | 75.0% |
| Interquartile 25% (IQ1) | 67.9% | 59.1% |
| Interquartile 75% (IQ3) | 73.9% | 84.8% |
| Interquartile Range (IQR) | 5.9% | 25.7% |
| Standard Deviation (Sample) | 8.5% | 16.7% |
| Standard Deviation (Population) | 8.4% | 16.6% |
Similar Demographics by In Labor Force | Age 20-24
Demographics Similar to Immigrants from Hong Kong by In Labor Force | Age 20-24
In terms of in labor force | age 20-24, the demographic groups most similar to Immigrants from Hong Kong are Immigrants from Israel (71.6%, a difference of 0.030%), Immigrants from Armenia (71.7%, a difference of 0.090%), Trinidadian and Tobagonian (71.5%, a difference of 0.11%), Immigrants from Taiwan (71.5%, a difference of 0.16%), and Immigrants from Eastern Asia (71.8%, a difference of 0.26%).
| Demographics | Rating | Rank | In Labor Force | Age 20-24 |
| Apache | 0.0 /100 | #311 | Tragic 72.0% |
| Immigrants | Caribbean | 0.0 /100 | #312 | Tragic 71.9% |
| Immigrants | Dominica | 0.0 /100 | #313 | Tragic 71.9% |
| Indians (Asian) | 0.0 /100 | #314 | Tragic 71.9% |
| Immigrants | Iran | 0.0 /100 | #315 | Tragic 71.8% |
| Immigrants | Eastern Asia | 0.0 /100 | #316 | Tragic 71.8% |
| Immigrants | Armenia | 0.0 /100 | #317 | Tragic 71.7% |
| Immigrants | Hong Kong | 0.0 /100 | #318 | Tragic 71.6% |
| Immigrants | Israel | 0.0 /100 | #319 | Tragic 71.6% |
| Trinidadians and Tobagonians | 0.0 /100 | #320 | Tragic 71.5% |
| Immigrants | Taiwan | 0.0 /100 | #321 | Tragic 71.5% |
| Filipinos | 0.0 /100 | #322 | Tragic 71.4% |
| West Indians | 0.0 /100 | #323 | Tragic 71.3% |
| Immigrants | Dominican Republic | 0.0 /100 | #324 | Tragic 71.2% |
| Barbadians | 0.0 /100 | #325 | Tragic 71.1% |
Demographics Similar to Pueblo by In Labor Force | Age 20-24
In terms of in labor force | age 20-24, the demographic groups most similar to Pueblo are Immigrants from Belize (72.8%, a difference of 0.060%), Immigrants from Nicaragua (72.9%, a difference of 0.090%), Immigrants from Argentina (72.8%, a difference of 0.090%), Immigrants from Belarus (73.0%, a difference of 0.17%), and Okinawan (72.7%, a difference of 0.20%).
| Demographics | Rating | Rank | In Labor Force | Age 20-24 |
| Nicaraguans | 0.1 /100 | #285 | Tragic 73.2% |
| Immigrants | Lebanon | 0.1 /100 | #286 | Tragic 73.1% |
| Immigrants | Korea | 0.1 /100 | #287 | Tragic 73.1% |
| Argentineans | 0.1 /100 | #288 | Tragic 73.1% |
| U.S. Virgin Islanders | 0.1 /100 | #289 | Tragic 73.0% |
| Immigrants | Belarus | 0.1 /100 | #290 | Tragic 73.0% |
| Immigrants | Nicaragua | 0.0 /100 | #291 | Tragic 72.9% |
| Pueblo | 0.0 /100 | #292 | Tragic 72.9% |
| Immigrants | Belize | 0.0 /100 | #293 | Tragic 72.8% |
| Immigrants | Argentina | 0.0 /100 | #294 | Tragic 72.8% |
| Okinawans | 0.0 /100 | #295 | Tragic 72.7% |
| Jamaicans | 0.0 /100 | #296 | Tragic 72.7% |
| Central American Indians | 0.0 /100 | #297 | Tragic 72.7% |
| Israelis | 0.0 /100 | #298 | Tragic 72.6% |
| Iranians | 0.0 /100 | #299 | Tragic 72.6% |