Shoshone vs Iranian In Labor Force | Age 20-24
COMPARE
Shoshone
Iranian
In Labor Force | Age 20-24
In Labor Force | Age 20-24 Comparison
Shoshone
Iranians
76.1%
IN LABOR FORCE | AGE 20-24
97.8/ 100
METRIC RATING
100th/ 347
METRIC RANK
72.6%
IN LABOR FORCE | AGE 20-24
0.0/ 100
METRIC RATING
299th/ 347
METRIC RANK
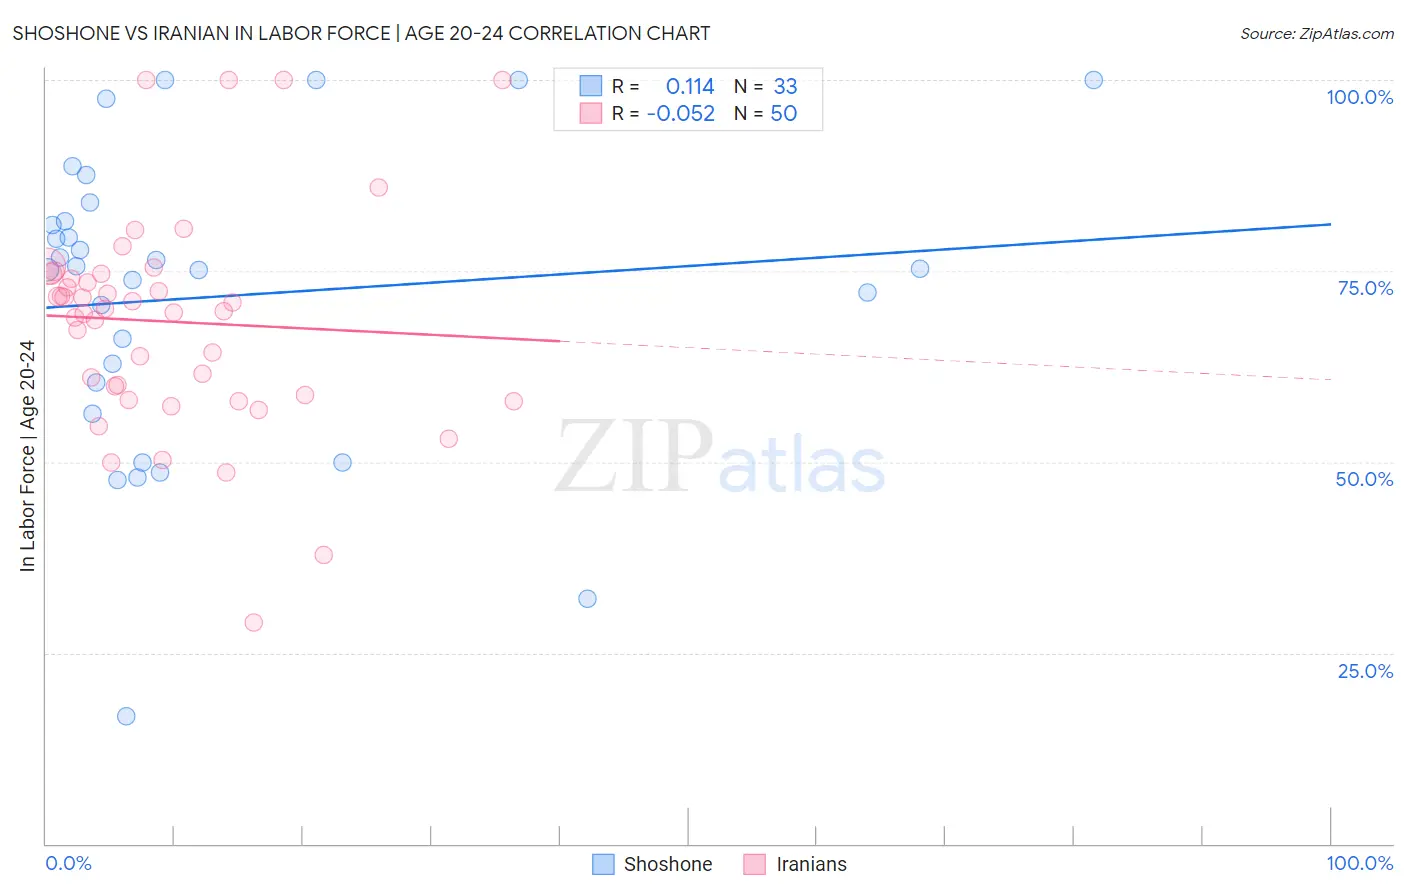
Shoshone vs Iranian In Labor Force | Age 20-24 Correlation Chart
The statistical analysis conducted on geographies consisting of 66,581,429 people shows a poor positive correlation between the proportion of Shoshone and labor force participation rate among population between the ages 20 and 24 in the United States with a correlation coefficient (R) of 0.114 and weighted average of 76.1%. Similarly, the statistical analysis conducted on geographies consisting of 316,816,770 people shows a slight negative correlation between the proportion of Iranians and labor force participation rate among population between the ages 20 and 24 in the United States with a correlation coefficient (R) of -0.052 and weighted average of 72.6%, a difference of 4.9%.
In Labor Force | Age 20-24 Correlation Summary
| Measurement | Shoshone | Iranian |
| Minimum | 16.7% | 28.9% |
| Maximum | 100.0% | 100.0% |
| Range | 83.3% | 71.1% |
| Mean | 71.7% | 68.4% |
| Median | 75.4% | 69.9% |
| Interquartile 25% (IQ1) | 58.4% | 58.8% |
| Interquartile 75% (IQ3) | 82.8% | 74.6% |
| Interquartile Range (IQR) | 24.4% | 15.8% |
| Standard Deviation (Sample) | 19.9% | 14.3% |
| Standard Deviation (Population) | 19.6% | 14.2% |
Similar Demographics by In Labor Force | Age 20-24
Demographics Similar to Shoshone by In Labor Force | Age 20-24
In terms of in labor force | age 20-24, the demographic groups most similar to Shoshone are American (76.1%, a difference of 0.0%), Immigrants from Poland (76.1%, a difference of 0.020%), Latvian (76.1%, a difference of 0.020%), Immigrants from Lithuania (76.1%, a difference of 0.040%), and Immigrants from Oceania (76.1%, a difference of 0.040%).
| Demographics | Rating | Rank | In Labor Force | Age 20-24 |
| Hungarians | 98.9 /100 | #93 | Exceptional 76.3% |
| Potawatomi | 98.5 /100 | #94 | Exceptional 76.2% |
| Immigrants | Germany | 98.5 /100 | #95 | Exceptional 76.2% |
| Immigrants | Nonimmigrants | 98.5 /100 | #96 | Exceptional 76.2% |
| Immigrants | Lithuania | 98.0 /100 | #97 | Exceptional 76.1% |
| Immigrants | Oceania | 98.0 /100 | #98 | Exceptional 76.1% |
| Americans | 97.8 /100 | #99 | Exceptional 76.1% |
| Shoshone | 97.8 /100 | #100 | Exceptional 76.1% |
| Immigrants | Poland | 97.7 /100 | #101 | Exceptional 76.1% |
| Latvians | 97.6 /100 | #102 | Exceptional 76.1% |
| Immigrants | North Macedonia | 97.5 /100 | #103 | Exceptional 76.1% |
| Macedonians | 97.2 /100 | #104 | Exceptional 76.0% |
| Immigrants | Nepal | 97.2 /100 | #105 | Exceptional 76.0% |
| Immigrants | Uganda | 97.1 /100 | #106 | Exceptional 76.0% |
| Greeks | 96.9 /100 | #107 | Exceptional 76.0% |
Demographics Similar to Iranians by In Labor Force | Age 20-24
In terms of in labor force | age 20-24, the demographic groups most similar to Iranians are Armenian (72.5%, a difference of 0.020%), Israeli (72.6%, a difference of 0.040%), Cuban (72.5%, a difference of 0.090%), Central American Indian (72.7%, a difference of 0.17%), and Native/Alaskan (72.4%, a difference of 0.18%).
| Demographics | Rating | Rank | In Labor Force | Age 20-24 |
| Pueblo | 0.0 /100 | #292 | Tragic 72.9% |
| Immigrants | Belize | 0.0 /100 | #293 | Tragic 72.8% |
| Immigrants | Argentina | 0.0 /100 | #294 | Tragic 72.8% |
| Okinawans | 0.0 /100 | #295 | Tragic 72.7% |
| Jamaicans | 0.0 /100 | #296 | Tragic 72.7% |
| Central American Indians | 0.0 /100 | #297 | Tragic 72.7% |
| Israelis | 0.0 /100 | #298 | Tragic 72.6% |
| Iranians | 0.0 /100 | #299 | Tragic 72.6% |
| Armenians | 0.0 /100 | #300 | Tragic 72.5% |
| Cubans | 0.0 /100 | #301 | Tragic 72.5% |
| Natives/Alaskans | 0.0 /100 | #302 | Tragic 72.4% |
| Ecuadorians | 0.0 /100 | #303 | Tragic 72.4% |
| Immigrants | West Indies | 0.0 /100 | #304 | Tragic 72.4% |
| Immigrants | Singapore | 0.0 /100 | #305 | Tragic 72.4% |
| Immigrants | Jamaica | 0.0 /100 | #306 | Tragic 72.4% |