Australian vs Immigrants from Poland Child Poverty Under the Age of 5
COMPARE
Australian
Immigrants from Poland
Child Poverty Under the Age of 5
Child Poverty Under the Age of 5 Comparison
Australians
Immigrants from Poland
15.5%
CHILD POVERTY UNDER THE AGE OF 5
98.0/ 100
METRIC RATING
79th/ 347
METRIC RANK
15.1%
CHILD POVERTY UNDER THE AGE OF 5
99.1/ 100
METRIC RATING
61st/ 347
METRIC RANK
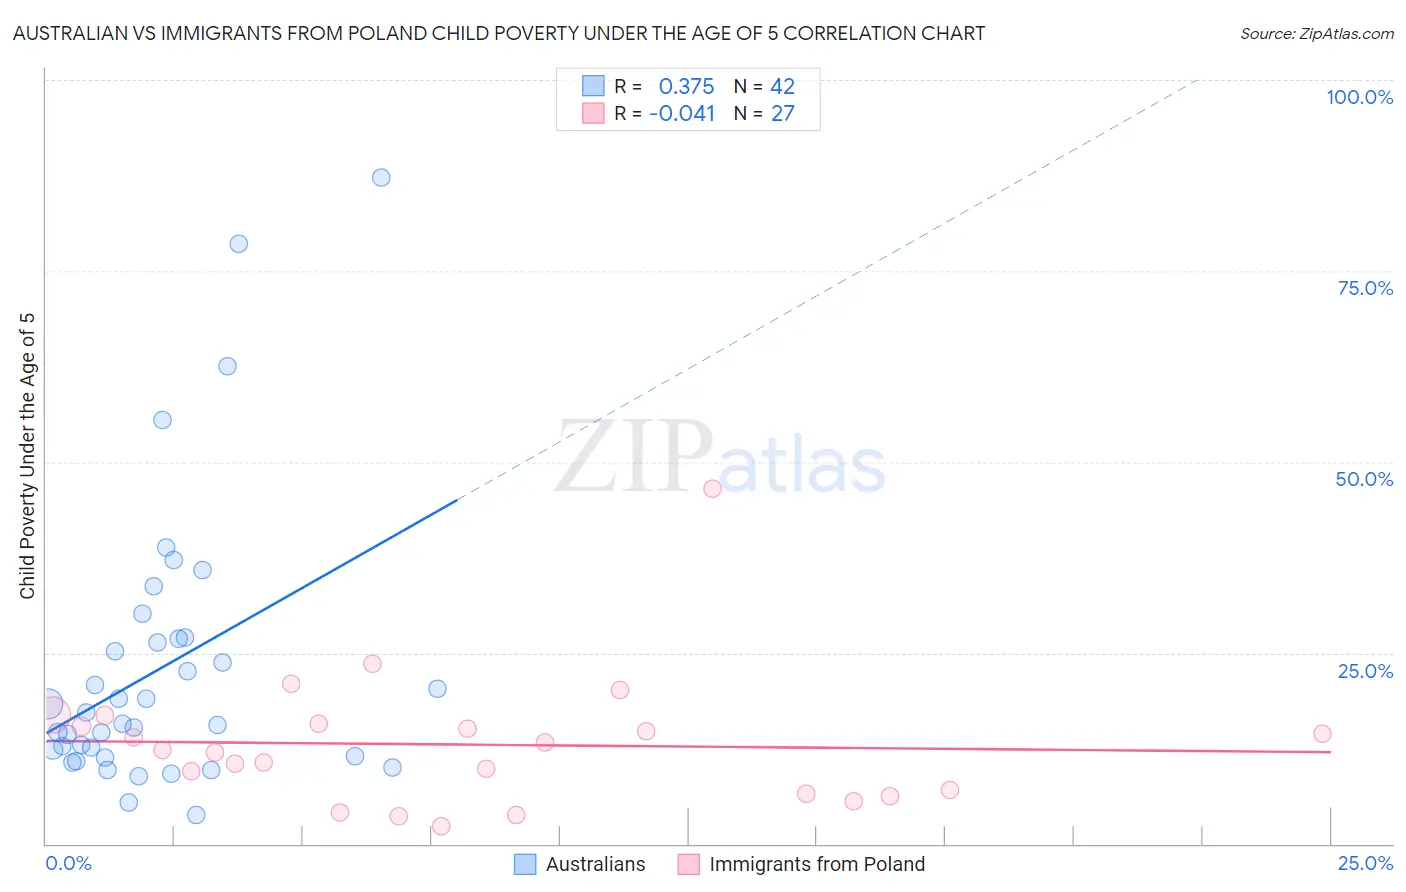
Australian vs Immigrants from Poland Child Poverty Under the Age of 5 Correlation Chart
The statistical analysis conducted on geographies consisting of 216,887,244 people shows a mild positive correlation between the proportion of Australians and poverty level among children under the age of 5 in the United States with a correlation coefficient (R) of 0.375 and weighted average of 15.5%. Similarly, the statistical analysis conducted on geographies consisting of 290,713,862 people shows no correlation between the proportion of Immigrants from Poland and poverty level among children under the age of 5 in the United States with a correlation coefficient (R) of -0.041 and weighted average of 15.1%, a difference of 2.5%.
Child Poverty Under the Age of 5 Correlation Summary
| Measurement | Australian | Immigrants from Poland |
| Minimum | 3.7% | 2.2% |
| Maximum | 87.2% | 46.5% |
| Range | 83.5% | 44.3% |
| Mean | 23.0% | 13.0% |
| Median | 16.5% | 12.3% |
| Interquartile 25% (IQ1) | 11.4% | 6.5% |
| Interquartile 75% (IQ3) | 26.9% | 15.7% |
| Interquartile Range (IQR) | 15.5% | 9.2% |
| Standard Deviation (Sample) | 18.3% | 8.7% |
| Standard Deviation (Population) | 18.1% | 8.6% |
Demographics Similar to Australians and Immigrants from Poland by Child Poverty Under the Age of 5
In terms of child poverty under the age of 5, the demographic groups most similar to Australians are Italian (15.5%, a difference of 0.11%), Sri Lankan (15.5%, a difference of 0.25%), Immigrants from Turkey (15.4%, a difference of 0.58%), Immigrants from Argentina (15.4%, a difference of 0.79%), and Croatian (15.4%, a difference of 0.79%). Similarly, the demographic groups most similar to Immigrants from Poland are Immigrants from Eastern Europe (15.1%, a difference of 0.12%), Immigrants from Europe (15.1%, a difference of 0.25%), Immigrants from Romania (15.2%, a difference of 0.27%), Immigrants from Fiji (15.2%, a difference of 0.30%), and Immigrants from Scotland (15.2%, a difference of 0.42%).
| Demographics | Rating | Rank | Child Poverty Under the Age of 5 |
| Immigrants | Russia | 99.3 /100 | #60 | Exceptional 15.0% |
| Immigrants | Poland | 99.1 /100 | #61 | Exceptional 15.1% |
| Immigrants | Eastern Europe | 99.1 /100 | #62 | Exceptional 15.1% |
| Immigrants | Europe | 99.1 /100 | #63 | Exceptional 15.1% |
| Immigrants | Romania | 99.1 /100 | #64 | Exceptional 15.2% |
| Immigrants | Fiji | 99.0 /100 | #65 | Exceptional 15.2% |
| Immigrants | Scotland | 99.0 /100 | #66 | Exceptional 15.2% |
| Greeks | 99.0 /100 | #67 | Exceptional 15.2% |
| Zimbabweans | 99.0 /100 | #68 | Exceptional 15.2% |
| Lithuanians | 99.0 /100 | #69 | Exceptional 15.2% |
| Immigrants | Belgium | 98.8 /100 | #70 | Exceptional 15.3% |
| Immigrants | Egypt | 98.8 /100 | #71 | Exceptional 15.3% |
| Immigrants | Sweden | 98.8 /100 | #72 | Exceptional 15.3% |
| Immigrants | Ukraine | 98.7 /100 | #73 | Exceptional 15.3% |
| Argentineans | 98.5 /100 | #74 | Exceptional 15.4% |
| Immigrants | Argentina | 98.5 /100 | #75 | Exceptional 15.4% |
| Croatians | 98.5 /100 | #76 | Exceptional 15.4% |
| Immigrants | Turkey | 98.3 /100 | #77 | Exceptional 15.4% |
| Sri Lankans | 98.1 /100 | #78 | Exceptional 15.5% |
| Australians | 98.0 /100 | #79 | Exceptional 15.5% |
| Italians | 97.9 /100 | #80 | Exceptional 15.5% |