Nonimmigrants vs German Russian In Labor Force | Age 16-19
COMPARE
Nonimmigrants
German Russian
In Labor Force | Age 16-19
In Labor Force | Age 16-19 Comparison
Nonimmigrants
German Russians
40.1%
IN LABOR FORCE | AGE 16-19
100.0/ 100
METRIC RATING
66th/ 347
METRIC RANK
42.4%
IN LABOR FORCE | AGE 16-19
100.0/ 100
METRIC RATING
25th/ 347
METRIC RANK
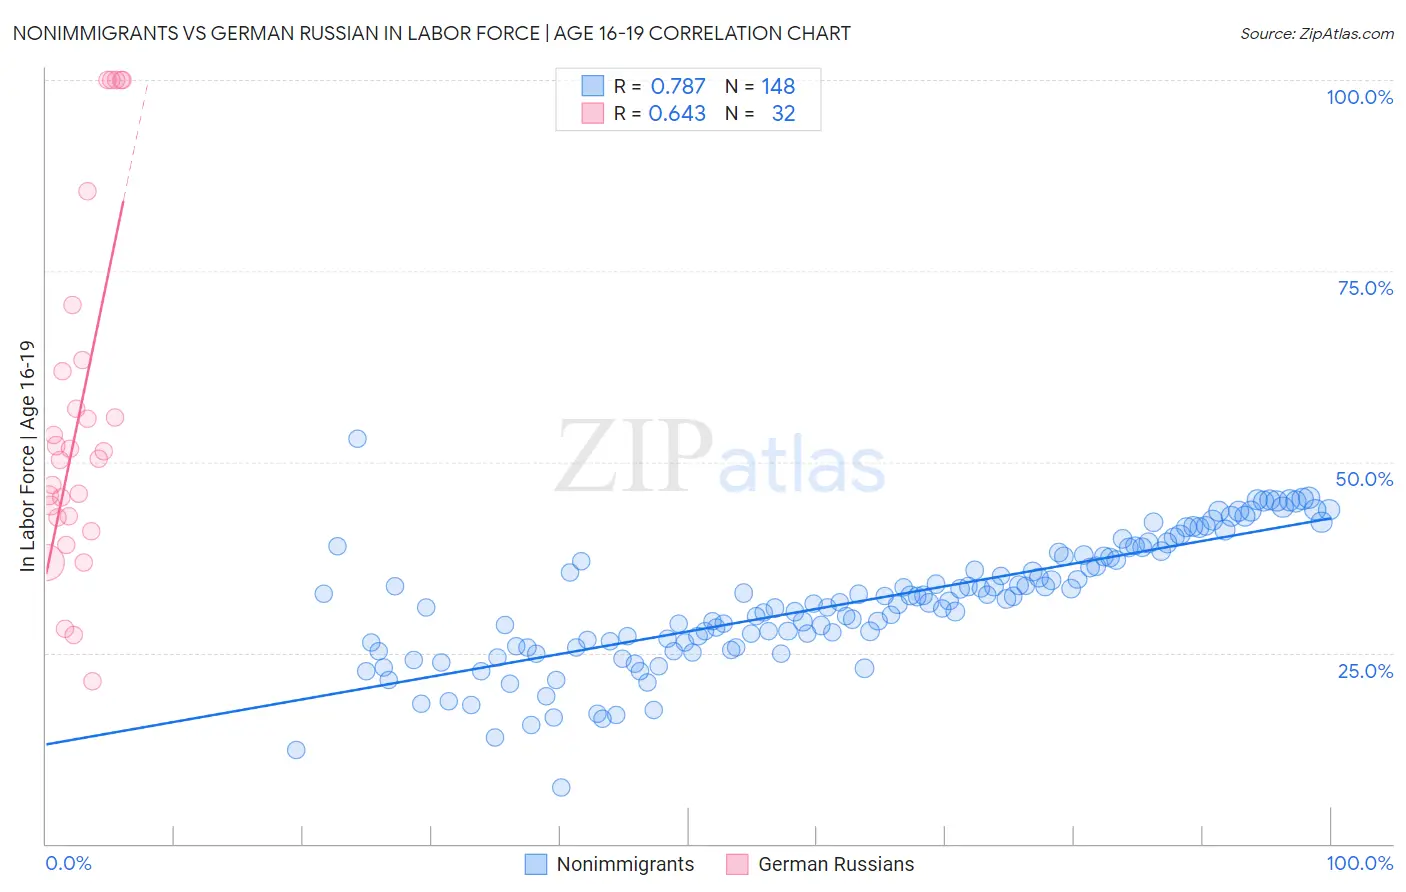
Nonimmigrants vs German Russian In Labor Force | Age 16-19 Correlation Chart
The statistical analysis conducted on geographies consisting of 578,466,762 people shows a strong positive correlation between the proportion of Nonimmigrants and labor force participation rate among population between the ages 16 and 19 in the United States with a correlation coefficient (R) of 0.787 and weighted average of 40.1%. Similarly, the statistical analysis conducted on geographies consisting of 96,426,343 people shows a significant positive correlation between the proportion of German Russians and labor force participation rate among population between the ages 16 and 19 in the United States with a correlation coefficient (R) of 0.643 and weighted average of 42.4%, a difference of 5.8%.
In Labor Force | Age 16-19 Correlation Summary
| Measurement | Nonimmigrants | German Russian |
| Minimum | 7.3% | 21.3% |
| Maximum | 53.1% | 100.0% |
| Range | 45.8% | 78.7% |
| Mean | 31.6% | 56.3% |
| Median | 31.6% | 50.9% |
| Interquartile 25% (IQ1) | 25.8% | 42.8% |
| Interquartile 75% (IQ3) | 37.7% | 62.6% |
| Interquartile Range (IQR) | 12.0% | 19.8% |
| Standard Deviation (Sample) | 8.3% | 22.7% |
| Standard Deviation (Population) | 8.3% | 22.3% |
Similar Demographics by In Labor Force | Age 16-19
Demographics Similar to Nonimmigrants by In Labor Force | Age 16-19
In terms of in labor force | age 16-19, the demographic groups most similar to Nonimmigrants are Canadian (40.1%, a difference of 0.010%), Italian (40.1%, a difference of 0.070%), Kenyan (40.1%, a difference of 0.12%), Potawatomi (40.0%, a difference of 0.14%), and Portuguese (40.0%, a difference of 0.19%).
| Demographics | Rating | Rank | In Labor Force | Age 16-19 |
| Slavs | 100.0 /100 | #59 | Exceptional 40.4% |
| Immigrants | Eastern Africa | 100.0 /100 | #60 | Exceptional 40.4% |
| Americans | 100.0 /100 | #61 | Exceptional 40.3% |
| Cherokee | 100.0 /100 | #62 | Exceptional 40.2% |
| Northern Europeans | 100.0 /100 | #63 | Exceptional 40.2% |
| Immigrants | Micronesia | 100.0 /100 | #64 | Exceptional 40.2% |
| Kenyans | 100.0 /100 | #65 | Exceptional 40.1% |
| Immigrants | Nonimmigrants | 100.0 /100 | #66 | Exceptional 40.1% |
| Canadians | 100.0 /100 | #67 | Exceptional 40.1% |
| Italians | 99.9 /100 | #68 | Exceptional 40.1% |
| Potawatomi | 99.9 /100 | #69 | Exceptional 40.0% |
| Portuguese | 99.9 /100 | #70 | Exceptional 40.0% |
| Serbians | 99.9 /100 | #71 | Exceptional 39.9% |
| Iroquois | 99.9 /100 | #72 | Exceptional 39.9% |
| Immigrants | Middle Africa | 99.9 /100 | #73 | Exceptional 39.9% |
Demographics Similar to German Russians by In Labor Force | Age 16-19
In terms of in labor force | age 16-19, the demographic groups most similar to German Russians are Bangladeshi (42.5%, a difference of 0.080%), English (42.4%, a difference of 0.13%), Welsh (42.3%, a difference of 0.40%), Slovak (42.6%, a difference of 0.41%), and Polish (42.1%, a difference of 0.70%).
| Demographics | Rating | Rank | In Labor Force | Age 16-19 |
| French Canadians | 100.0 /100 | #18 | Exceptional 43.6% |
| Belgians | 100.0 /100 | #19 | Exceptional 43.4% |
| Swiss | 100.0 /100 | #20 | Exceptional 43.3% |
| Ottawa | 100.0 /100 | #21 | Exceptional 43.0% |
| Sudanese | 100.0 /100 | #22 | Exceptional 42.9% |
| Slovaks | 100.0 /100 | #23 | Exceptional 42.6% |
| Bangladeshis | 100.0 /100 | #24 | Exceptional 42.5% |
| German Russians | 100.0 /100 | #25 | Exceptional 42.4% |
| English | 100.0 /100 | #26 | Exceptional 42.4% |
| Welsh | 100.0 /100 | #27 | Exceptional 42.3% |
| Poles | 100.0 /100 | #28 | Exceptional 42.1% |
| French | 100.0 /100 | #29 | Exceptional 42.1% |
| Scottish | 100.0 /100 | #30 | Exceptional 42.0% |
| Irish | 100.0 /100 | #31 | Exceptional 42.0% |
| Czechoslovakians | 100.0 /100 | #32 | Exceptional 41.9% |