Mongolian vs German Russian In Labor Force | Age 16-19
COMPARE
Mongolian
German Russian
In Labor Force | Age 16-19
In Labor Force | Age 16-19 Comparison
Mongolians
German Russians
35.3%
IN LABOR FORCE | AGE 16-19
5.7/ 100
METRIC RATING
227th/ 347
METRIC RANK
42.4%
IN LABOR FORCE | AGE 16-19
100.0/ 100
METRIC RATING
25th/ 347
METRIC RANK
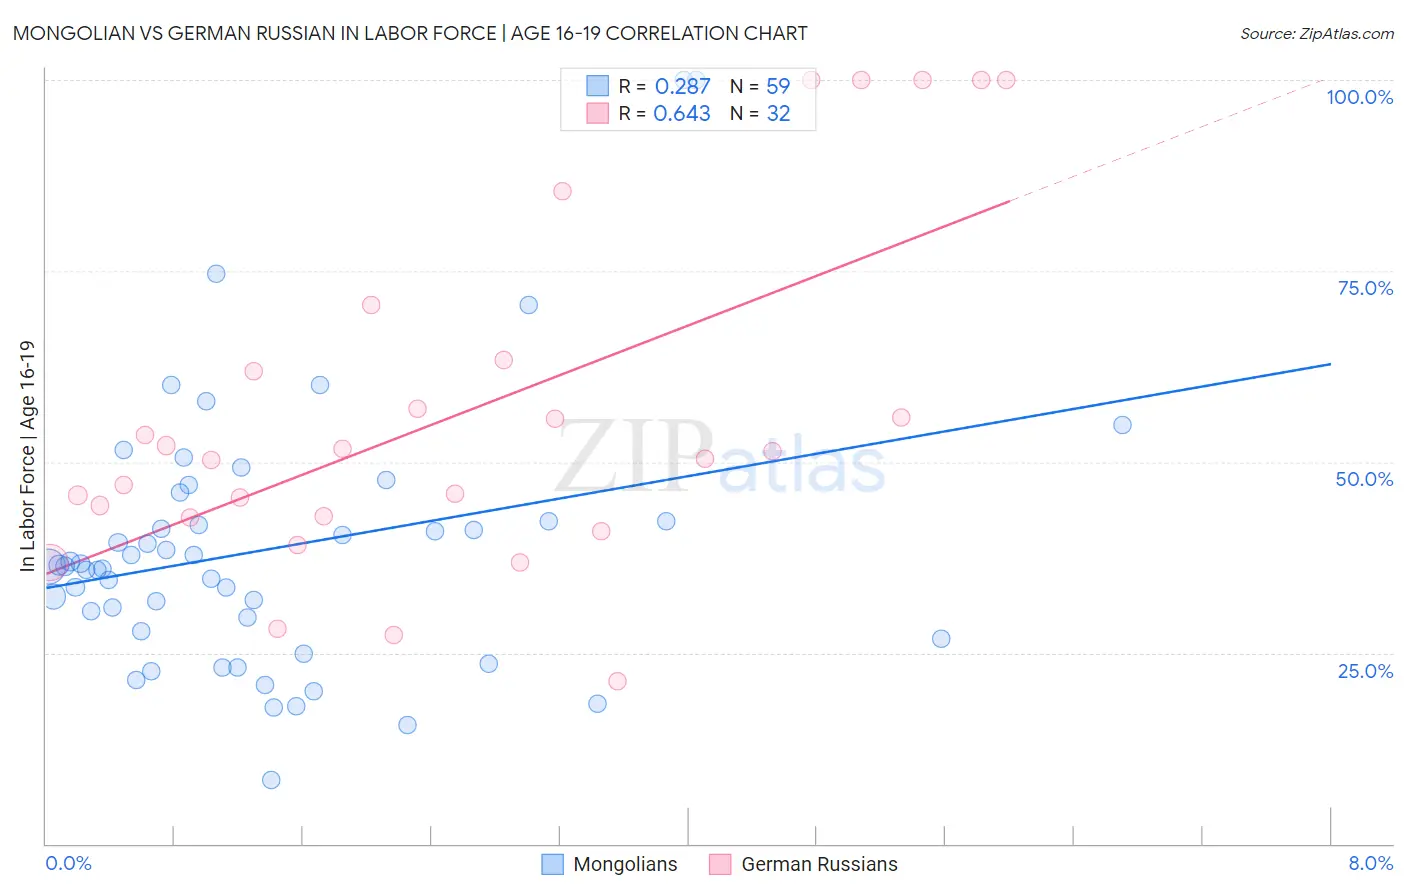
Mongolian vs German Russian In Labor Force | Age 16-19 Correlation Chart
The statistical analysis conducted on geographies consisting of 140,345,007 people shows a weak positive correlation between the proportion of Mongolians and labor force participation rate among population between the ages 16 and 19 in the United States with a correlation coefficient (R) of 0.287 and weighted average of 35.3%. Similarly, the statistical analysis conducted on geographies consisting of 96,426,343 people shows a significant positive correlation between the proportion of German Russians and labor force participation rate among population between the ages 16 and 19 in the United States with a correlation coefficient (R) of 0.643 and weighted average of 42.4%, a difference of 20.3%.
In Labor Force | Age 16-19 Correlation Summary
| Measurement | Mongolian | German Russian |
| Minimum | 8.3% | 21.3% |
| Maximum | 100.0% | 100.0% |
| Range | 91.7% | 78.7% |
| Mean | 38.6% | 56.3% |
| Median | 36.4% | 50.9% |
| Interquartile 25% (IQ1) | 27.9% | 42.8% |
| Interquartile 75% (IQ3) | 42.3% | 62.6% |
| Interquartile Range (IQR) | 14.4% | 19.8% |
| Standard Deviation (Sample) | 17.5% | 22.7% |
| Standard Deviation (Population) | 17.3% | 22.3% |
Similar Demographics by In Labor Force | Age 16-19
Demographics Similar to Mongolians by In Labor Force | Age 16-19
In terms of in labor force | age 16-19, the demographic groups most similar to Mongolians are Immigrants from Guatemala (35.3%, a difference of 0.010%), Immigrants from Senegal (35.3%, a difference of 0.050%), Immigrants from Belgium (35.3%, a difference of 0.10%), Honduran (35.3%, a difference of 0.18%), and Immigrants from Lebanon (35.2%, a difference of 0.18%).
| Demographics | Rating | Rank | In Labor Force | Age 16-19 |
| Immigrants | Bahamas | 8.3 /100 | #220 | Tragic 35.5% |
| Turks | 7.3 /100 | #221 | Tragic 35.4% |
| Immigrants | Ghana | 7.3 /100 | #222 | Tragic 35.4% |
| Ghanaians | 6.5 /100 | #223 | Tragic 35.3% |
| Hondurans | 6.5 /100 | #224 | Tragic 35.3% |
| Immigrants | Belgium | 6.1 /100 | #225 | Tragic 35.3% |
| Immigrants | Guatemala | 5.7 /100 | #226 | Tragic 35.3% |
| Mongolians | 5.7 /100 | #227 | Tragic 35.3% |
| Immigrants | Senegal | 5.5 /100 | #228 | Tragic 35.3% |
| Immigrants | Lebanon | 5.0 /100 | #229 | Tragic 35.2% |
| Immigrants | Honduras | 4.9 /100 | #230 | Tragic 35.2% |
| Immigrants | Syria | 4.5 /100 | #231 | Tragic 35.2% |
| Immigrants | Kazakhstan | 4.5 /100 | #232 | Tragic 35.2% |
| Immigrants | France | 4.3 /100 | #233 | Tragic 35.1% |
| Immigrants | Mexico | 4.2 /100 | #234 | Tragic 35.1% |
Demographics Similar to German Russians by In Labor Force | Age 16-19
In terms of in labor force | age 16-19, the demographic groups most similar to German Russians are Bangladeshi (42.5%, a difference of 0.080%), English (42.4%, a difference of 0.13%), Welsh (42.3%, a difference of 0.40%), Slovak (42.6%, a difference of 0.41%), and Polish (42.1%, a difference of 0.70%).
| Demographics | Rating | Rank | In Labor Force | Age 16-19 |
| French Canadians | 100.0 /100 | #18 | Exceptional 43.6% |
| Belgians | 100.0 /100 | #19 | Exceptional 43.4% |
| Swiss | 100.0 /100 | #20 | Exceptional 43.3% |
| Ottawa | 100.0 /100 | #21 | Exceptional 43.0% |
| Sudanese | 100.0 /100 | #22 | Exceptional 42.9% |
| Slovaks | 100.0 /100 | #23 | Exceptional 42.6% |
| Bangladeshis | 100.0 /100 | #24 | Exceptional 42.5% |
| German Russians | 100.0 /100 | #25 | Exceptional 42.4% |
| English | 100.0 /100 | #26 | Exceptional 42.4% |
| Welsh | 100.0 /100 | #27 | Exceptional 42.3% |
| Poles | 100.0 /100 | #28 | Exceptional 42.1% |
| French | 100.0 /100 | #29 | Exceptional 42.1% |
| Scottish | 100.0 /100 | #30 | Exceptional 42.0% |
| Irish | 100.0 /100 | #31 | Exceptional 42.0% |
| Czechoslovakians | 100.0 /100 | #32 | Exceptional 41.9% |