Mongolian vs Venezuelan In Labor Force | Age 20-64
COMPARE
Mongolian
Venezuelan
In Labor Force | Age 20-64
In Labor Force | Age 20-64 Comparison
Mongolians
Venezuelans
79.9%
IN LABOR FORCE | AGE 20-64
92.0/ 100
METRIC RATING
122nd/ 347
METRIC RANK
80.0%
IN LABOR FORCE | AGE 20-64
95.3/ 100
METRIC RATING
104th/ 347
METRIC RANK
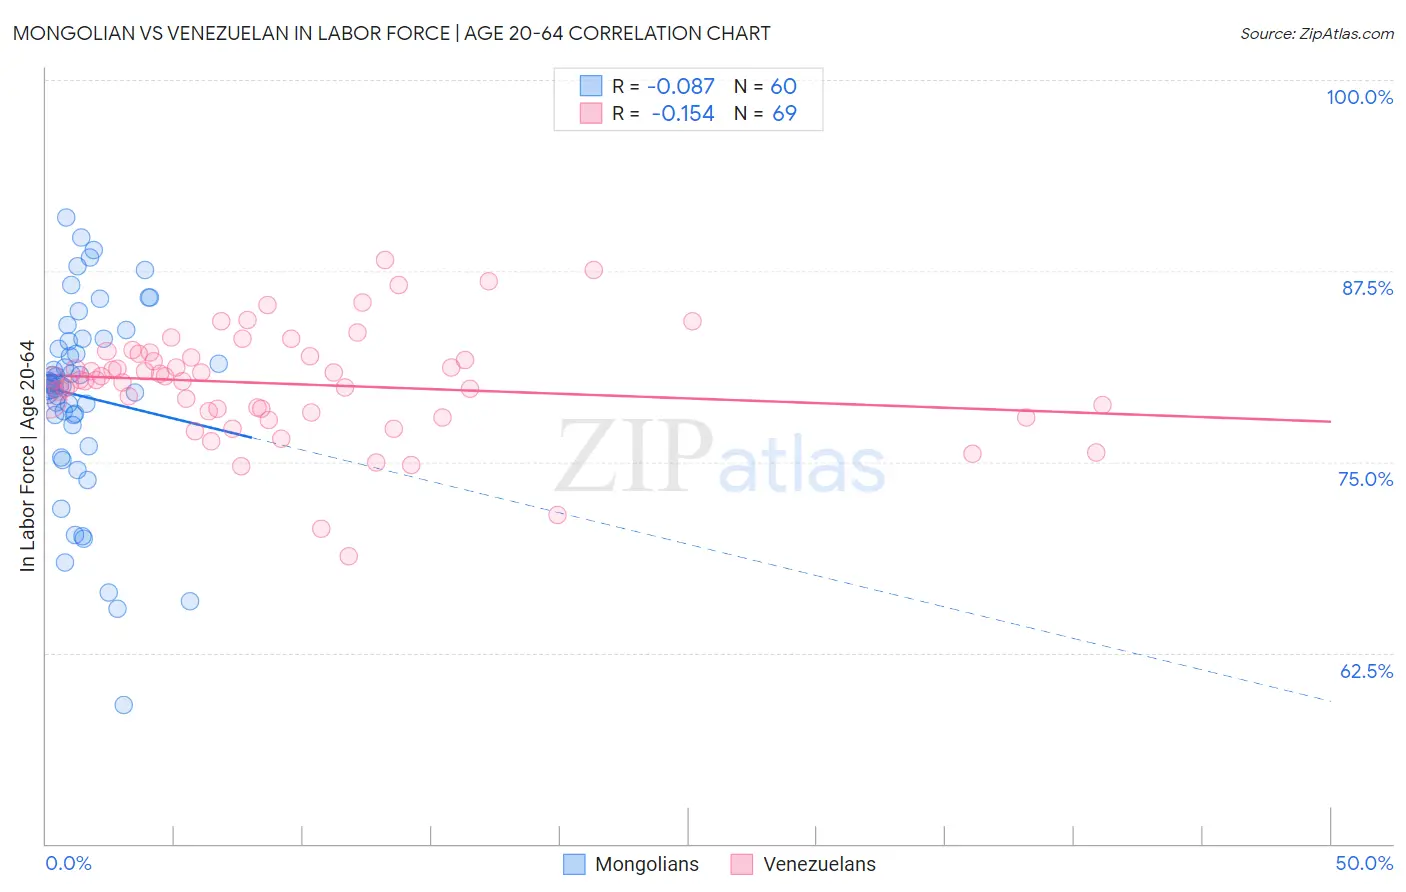
Mongolian vs Venezuelan In Labor Force | Age 20-64 Correlation Chart
The statistical analysis conducted on geographies consisting of 140,359,372 people shows a slight negative correlation between the proportion of Mongolians and labor force participation rate among population between the ages 20 and 64 in the United States with a correlation coefficient (R) of -0.087 and weighted average of 79.9%. Similarly, the statistical analysis conducted on geographies consisting of 306,339,015 people shows a poor negative correlation between the proportion of Venezuelans and labor force participation rate among population between the ages 20 and 64 in the United States with a correlation coefficient (R) of -0.154 and weighted average of 80.0%, a difference of 0.11%.
In Labor Force | Age 20-64 Correlation Summary
| Measurement | Mongolian | Venezuelan |
| Minimum | 59.1% | 68.8% |
| Maximum | 91.0% | 88.2% |
| Range | 31.9% | 19.4% |
| Mean | 79.3% | 80.1% |
| Median | 80.0% | 80.4% |
| Interquartile 25% (IQ1) | 77.7% | 78.3% |
| Interquartile 75% (IQ3) | 83.0% | 82.0% |
| Interquartile Range (IQR) | 5.3% | 3.7% |
| Standard Deviation (Sample) | 6.4% | 3.6% |
| Standard Deviation (Population) | 6.3% | 3.6% |
Demographics Similar to Mongolians and Venezuelans by In Labor Force | Age 20-64
In terms of in labor force | age 20-64, the demographic groups most similar to Mongolians are Immigrants from Taiwan (80.0%, a difference of 0.010%), Maltese (80.0%, a difference of 0.010%), Immigrants from Kuwait (80.0%, a difference of 0.010%), Immigrants from Russia (79.9%, a difference of 0.010%), and Immigrants from Vietnam (80.0%, a difference of 0.020%). Similarly, the demographic groups most similar to Venezuelans are Russian (80.0%, a difference of 0.010%), Immigrants from Ghana (80.0%, a difference of 0.010%), Greek (80.0%, a difference of 0.020%), Immigrants from Jordan (80.0%, a difference of 0.020%), and Iranian (80.0%, a difference of 0.040%).
| Demographics | Rating | Rank | In Labor Force | Age 20-64 |
| Russians | 95.5 /100 | #103 | Exceptional 80.0% |
| Venezuelans | 95.3 /100 | #104 | Exceptional 80.0% |
| Immigrants | Ghana | 95.0 /100 | #105 | Exceptional 80.0% |
| Greeks | 94.8 /100 | #106 | Exceptional 80.0% |
| Immigrants | Jordan | 94.8 /100 | #107 | Exceptional 80.0% |
| Iranians | 94.3 /100 | #108 | Exceptional 80.0% |
| Immigrants | Argentina | 94.1 /100 | #109 | Exceptional 80.0% |
| Estonians | 94.0 /100 | #110 | Exceptional 80.0% |
| Immigrants | South America | 93.9 /100 | #111 | Exceptional 80.0% |
| Immigrants | Italy | 93.9 /100 | #112 | Exceptional 80.0% |
| Sri Lankans | 93.9 /100 | #113 | Exceptional 80.0% |
| Argentineans | 93.8 /100 | #114 | Exceptional 80.0% |
| Bermudans | 93.3 /100 | #115 | Exceptional 80.0% |
| Immigrants | Western Africa | 93.1 /100 | #116 | Exceptional 80.0% |
| Immigrants | Vietnam | 92.7 /100 | #117 | Exceptional 80.0% |
| Cape Verdeans | 92.7 /100 | #118 | Exceptional 80.0% |
| Immigrants | Taiwan | 92.5 /100 | #119 | Exceptional 80.0% |
| Maltese | 92.4 /100 | #120 | Exceptional 80.0% |
| Immigrants | Kuwait | 92.2 /100 | #121 | Exceptional 80.0% |
| Mongolians | 92.0 /100 | #122 | Exceptional 79.9% |
| Immigrants | Russia | 91.8 /100 | #123 | Exceptional 79.9% |