Arapaho vs South American Indian In Labor Force | Age 35-44

COMPARE

Arapaho
Race
Ancestry
AfghanAfricanAlaska NativeAlaskan AthabascanAlbanianAleutAlsatianAmericanApacheArabArapahoArgentineanArmenianAssyrian/Chaldean/SyriacAustralianAustrianBahamianBangladeshiBarbadianBasqueBelgianBelizeanBermudanBhutaneseBlackfeetBolivianBrazilianBritishBritish West IndianBulgarianBurmeseCajunCambodianCanadianCape VerdeanCarpatho RusynCelticCentral AmericanCentral American IndianCherokeeCheyenneChickasawChileanChineseChippewaChoctawColombianColvilleComancheCosta RicanCreeCreekCroatianCrowCubanCypriotCzechCzechoslovakianDanishDelawareDominicanDutchDutch West IndianEastern EuropeanEcuadorianEgyptianEnglishEstonianEthiopianEuropeanFijianFilipinoFinnishFrenchFrench American IndianFrench CanadianGermanGerman RussianGhanaianGreekGuamanian/ChamorroGuatemalanGuyaneseHaitianHmongHonduranHopiHoumaHungarianIcelanderIndian (Asian)IndonesianInupiatIranianIraqiIrishIroquoisIsraeliItalianJamaicanJapaneseJordanianKenyanKiowaKoreanLaotianLatvianLebaneseLiberianLithuanianLumbeeLuxembourgerMacedonianMalaysianMalteseMarshalleseMenomineeMexicanMexican American IndianMongolianMoroccanNative HawaiianNavajoNepaleseNew ZealanderNicaraguanNigerianNorthern EuropeanNorwegianOkinawanOsageOttawaPaiutePakistaniPalestinianPanamanianParaguayanPennsylvania GermanPeruvianPimaPolishPortuguesePotawatomiPuebloPuerto RicanPuget Sound SalishRomanianRussianSalvadoranSamoanScandinavianScotch-IrishScottishSeminoleSenegaleseSerbianShoshoneSierra LeoneanSiouxSlavicSlovakSloveneSomaliSouth AfricanSouth AmericanSoviet UnionSpaniardSpanishSpanish AmericanSpanish American IndianSri LankanSubsaharan AfricanSudaneseSwedishSwissSyrianTaiwaneseThaiTlingit-HaidaTohono O'OdhamTonganTrinidadian and TobagonianTsimshianTurkishU.S. Virgin IslanderUgandanUkrainianUruguayanUteVenezuelanVietnameseWelshWest IndianYakamaYaquiYugoslavianYumanYup'ikZimbabwean
Immigration
NonimmigrantsImmigrantsAfghanistanAfricaAlbaniaArgentinaArmeniaAsiaAustraliaAustriaBahamasBangladeshBarbadosBelarusBelgiumBelizeBoliviaBosnia and HerzegovinaBrazilBulgariaBurma/MyanmarCabo VerdeCambodiaCameroonCanadaCaribbeanCentral AmericaChileChinaColombiaCongoCosta RicaCroatiaCubaCzechoslovakiaDenmarkDominicaDominican RepublicEastern AfricaEastern AsiaEastern EuropeEcuadorEgyptEl SalvadorEnglandEritreaEthiopiaEuropeFijiFranceGermanyGhanaGreeceGrenadaGuatemalaGuyanaHaitiHondurasHong KongHungaryIndiaIndonesiaIranIraqIrelandIsraelItalyJamaicaJapanJordanKazakhstanKenyaKoreaKuwaitLaosLatin AmericaLatviaLebanonLiberiaLithuaniaMalaysiaMexicoMicronesiaMiddle AfricaMoldovaMoroccoNepalNetherlandsNicaraguaNigeriaNorth AmericaNorth MacedoniaNorthern AfricaNorthern EuropeNorwayOceaniaPakistanPanamaPeruPhilippinesPolandPortugalRomaniaRussiaSaudi ArabiaScotlandSenegalSerbiaSierra LeoneSingaporeSomaliaSouth AfricaSouth AmericaSouth Central AsiaSouth Eastern AsiaSouthern EuropeSpainSri LankaSt. Vincent and the GrenadinesSudanSwedenSwitzerlandSyriaTaiwanThailandTrinidad and TobagoTurkeyUgandaUkraineUruguayUzbekistanVenezuelaVietnamWest IndiesWestern AfricaWestern AsiaWestern EuropeYemenZaireZimbabweAzores
South American Indian
Race
Ancestry
AfghanAfricanAlaska NativeAlaskan AthabascanAlbanianAleutAlsatianAmericanApacheArabArgentineanArmenianAssyrian/Chaldean/SyriacAustralianAustrianBahamianBangladeshiBarbadianBasqueBelgianBelizeanBermudanBhutaneseBlackfeetBolivianBrazilianBritishBritish West IndianBulgarianBurmeseCajunCambodianCanadianCape VerdeanCarpatho RusynCelticCentral AmericanCentral American IndianCherokeeCheyenneChickasawChileanChineseChippewaChoctawColombianColvilleComancheCosta RicanCreeCreekCroatianCrowCubanCypriotCzechCzechoslovakianDanishDelawareDominicanDutchDutch West IndianEastern EuropeanEcuadorianEgyptianEnglishEstonianEthiopianEuropeanFijianFilipinoFinnishFrenchFrench American IndianFrench CanadianGermanGerman RussianGhanaianGreekGuamanian/ChamorroGuatemalanGuyaneseHaitianHmongHonduranHopiHoumaHungarianIcelanderIndian (Asian)IndonesianInupiatIranianIraqiIrishIroquoisIsraeliItalianJamaicanJapaneseJordanianKenyanKiowaKoreanLaotianLatvianLebaneseLiberianLithuanianLumbeeLuxembourgerMacedonianMalaysianMalteseMarshalleseMenomineeMexicanMexican American IndianMongolianMoroccanNative HawaiianNavajoNepaleseNew ZealanderNicaraguanNigerianNorthern EuropeanNorwegianOkinawanOsageOttawaPaiutePakistaniPalestinianPanamanianParaguayanPennsylvania GermanPeruvianPimaPolishPortuguesePotawatomiPuebloPuerto RicanPuget Sound SalishRomanianRussianSalvadoranSamoanScandinavianScotch-IrishScottishSeminoleSenegaleseSerbianShoshoneSierra LeoneanSiouxSlavicSlovakSloveneSomaliSouth AfricanSouth AmericanSouth American IndianSoviet UnionSpaniardSpanishSpanish AmericanSpanish American IndianSri LankanSubsaharan AfricanSudaneseSwedishSwissSyrianTaiwaneseThaiTlingit-HaidaTohono O'OdhamTonganTrinidadian and TobagonianTsimshianTurkishU.S. Virgin IslanderUgandanUkrainianUruguayanUteVenezuelanVietnameseWelshWest IndianYakamaYaquiYugoslavianYumanYup'ikZimbabwean
Immigration
NonimmigrantsImmigrantsAfghanistanAfricaAlbaniaArgentinaArmeniaAsiaAustraliaAustriaBahamasBangladeshBarbadosBelarusBelgiumBelizeBoliviaBosnia and HerzegovinaBrazilBulgariaBurma/MyanmarCabo VerdeCambodiaCameroonCanadaCaribbeanCentral AmericaChileChinaColombiaCongoCosta RicaCroatiaCubaCzechoslovakiaDenmarkDominicaDominican RepublicEastern AfricaEastern AsiaEastern EuropeEcuadorEgyptEl SalvadorEnglandEritreaEthiopiaEuropeFijiFranceGermanyGhanaGreeceGrenadaGuatemalaGuyanaHaitiHondurasHong KongHungaryIndiaIndonesiaIranIraqIrelandIsraelItalyJamaicaJapanJordanKazakhstanKenyaKoreaKuwaitLaosLatin AmericaLatviaLebanonLiberiaLithuaniaMalaysiaMexicoMicronesiaMiddle AfricaMoldovaMoroccoNepalNetherlandsNicaraguaNigeriaNorth AmericaNorth MacedoniaNorthern AfricaNorthern EuropeNorwayOceaniaPakistanPanamaPeruPhilippinesPolandPortugalRomaniaRussiaSaudi ArabiaScotlandSenegalSerbiaSierra LeoneSingaporeSomaliaSouth AfricaSouth AmericaSouth Central AsiaSouth Eastern AsiaSouthern EuropeSpainSri LankaSt. Vincent and the GrenadinesSudanSwedenSwitzerlandSyriaTaiwanThailandTrinidad and TobagoTurkeyUgandaUkraineUruguayUzbekistanVenezuelaVietnamWest IndiesWestern AfricaWestern AsiaWestern EuropeYemenZaireZimbabweAzores
In Labor Force | Age 35-44
Income
Poverty
Unemployment
Labor Participation
Family Structure
Vehicle Availability
Education Level
Disability

In Labor Force | Age 35-44 Comparison

Arapaho

South American Indians

Tragic
Good
78.1%
IN LABOR FORCE | AGE 35-44
0.0/ 100
METRIC RATING
336th/ 347
METRIC RANK
84.5%
IN LABOR FORCE | AGE 35-44
73.6/ 100
METRIC RATING
148th/ 347
METRIC RANK

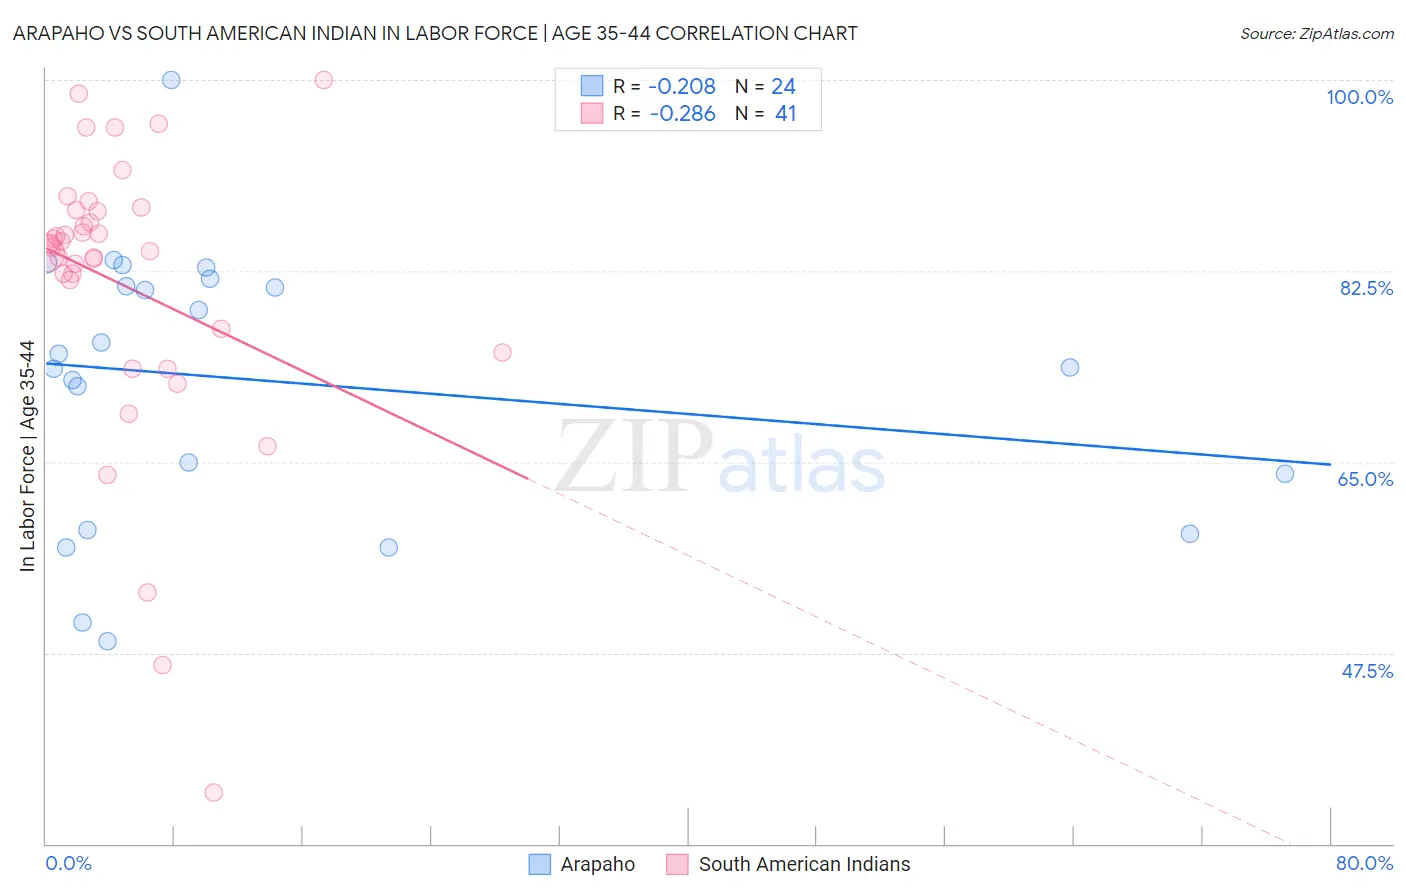
Arapaho vs South American Indian In Labor Force | Age 35-44 Correlation Chart

The statistical analysis conducted on geographies consisting of 29,776,637 people shows a weak negative correlation between the proportion of Arapaho and labor force participation rate among population between the ages 35 and 44 in the United States with a correlation coefficient (R) of -0.208 and weighted average of 78.1%. Similarly, the statistical analysis conducted on geographies consisting of 164,541,047 people shows a weak negative correlation between the proportion of South American Indians and labor force participation rate among population between the ages 35 and 44 in the United States with a correlation coefficient (R) of -0.286 and weighted average of 84.5%, a difference of 8.3%.
Arapaho vs South American Indian In Labor Force | Age 35-44

In Labor Force | Age 35-44 Correlation Summary

MeasurementArapahoSouth American Indian
Minimum48.6%34.7%
Maximum100.0%100.0%
Range51.4%65.3%
Mean72.4%81.3%
Median74.3%84.7%
Interquartile 25% (IQ1)61.4%76.1%
Interquartile 75% (IQ3)81.5%88.0%
Interquartile Range (IQR)20.1%11.9%
Standard Deviation (Sample)12.6%13.2%
Standard Deviation (Population)12.3%13.1%

Similar Demographics by In Labor Force | Age 35-44

Demographics Similar to Arapaho by In Labor Force | Age 35-44

In terms of in labor force | age 35-44, the demographic groups most similar to Arapaho are Apache (77.9%, a difference of 0.21%), Pueblo (77.4%, a difference of 0.91%), Yup'ik (77.3%, a difference of 1.0%), Native/Alaskan (78.9%, a difference of 1.0%), and Yakama (79.0%, a difference of 1.1%).
DemographicsRating | RankIn Labor Force | Age 35-44
Menominee
0.0
/100
|
#329
Tragic
79.7%
Cheyenne
0.0
/100
|
#330
Tragic
79.5%
Houma
0.0
/100
|
#331
Tragic
79.5%
Ute
0.0
/100
|
#332
Tragic
79.4%
Kiowa
0.0
/100
|
#333
Tragic
79.2%
Yakama
0.0
/100
|
#334
Tragic
79.0%
Natives/Alaskans
0.0
/100
|
#335
Tragic
78.9%
Arapaho
0.0
/100
|
#336
Tragic
78.1%
Apache
0.0
/100
|
#337
Tragic
77.9%
Pueblo
0.0
/100
|
#338
Tragic
77.4%
Yup'ik
0.0
/100
|
#339
Tragic
77.3%
Lumbee
0.0
/100
|
#340
Tragic
77.0%
Hopi
0.0
/100
|
#341
Tragic
77.0%
Crow
0.0
/100
|
#342
Tragic
76.5%
Immigrants | Yemen
0.0
/100
|
#343
Tragic
76.3%

Demographics Similar to South American Indians by In Labor Force | Age 35-44

In terms of in labor force | age 35-44, the demographic groups most similar to South American Indians are Okinawan (84.5%, a difference of 0.0%), Immigrants from Nigeria (84.5%, a difference of 0.0%), Romanian (84.5%, a difference of 0.010%), Immigrants from Taiwan (84.5%, a difference of 0.020%), and Immigrants from Netherlands (84.5%, a difference of 0.030%).
DemographicsRating | RankIn Labor Force | Age 35-44
Immigrants | Belgium
80.8
/100
|
#141
Excellent
84.6%
Immigrants | Uruguay
80.1
/100
|
#142
Excellent
84.6%
Immigrants | Ukraine
79.7
/100
|
#143
Good
84.6%
Immigrants | Jamaica
79.4
/100
|
#144
Good
84.6%
Immigrants | Saudi Arabia
79.4
/100
|
#145
Good
84.6%
Immigrants | Asia
78.7
/100
|
#146
Good
84.5%
Immigrants | Netherlands
76.6
/100
|
#147
Good
84.5%
South American Indians
73.6
/100
|
#148
Good
84.5%
Okinawans
73.5
/100
|
#149
Good
84.5%
Immigrants | Nigeria
73.3
/100
|
#150
Good
84.5%
Romanians
72.1
/100
|
#151
Good
84.5%
Immigrants | Taiwan
71.4
/100
|
#152
Good
84.5%
Trinidadians and Tobagonians
69.5
/100
|
#153
Good
84.5%
Iranians
69.4
/100
|
#154
Good
84.5%
Immigrants | Switzerland
65.9
/100
|
#155
Good
84.5%