Asian vs Ukrainian In Labor Force | Age 35-44
COMPARE
Asian
Ukrainian
In Labor Force | Age 35-44
In Labor Force | Age 35-44 Comparison
Asians
Ukrainians
84.7%
IN LABOR FORCE | AGE 35-44
90.6/ 100
METRIC RATING
126th/ 347
METRIC RANK
84.7%
IN LABOR FORCE | AGE 35-44
93.5/ 100
METRIC RATING
111th/ 347
METRIC RANK
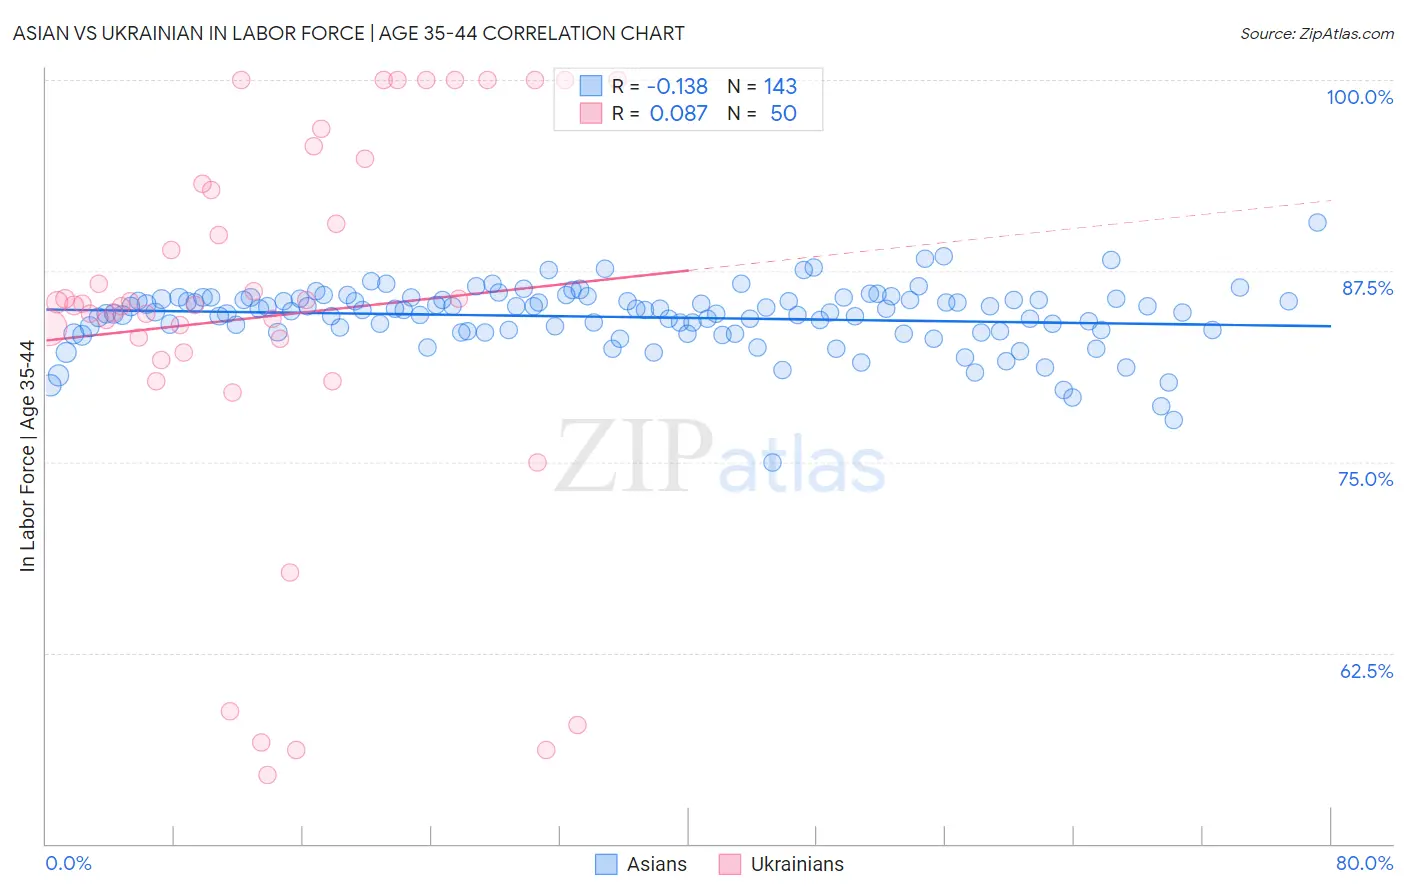
Asian vs Ukrainian In Labor Force | Age 35-44 Correlation Chart
The statistical analysis conducted on geographies consisting of 550,310,951 people shows a poor negative correlation between the proportion of Asians and labor force participation rate among population between the ages 35 and 44 in the United States with a correlation coefficient (R) of -0.138 and weighted average of 84.7%. Similarly, the statistical analysis conducted on geographies consisting of 448,358,650 people shows a slight positive correlation between the proportion of Ukrainians and labor force participation rate among population between the ages 35 and 44 in the United States with a correlation coefficient (R) of 0.087 and weighted average of 84.7%, a difference of 0.060%.
In Labor Force | Age 35-44 Correlation Summary
| Measurement | Asian | Ukrainian |
| Minimum | 74.9% | 54.5% |
| Maximum | 90.7% | 100.0% |
| Range | 15.8% | 45.5% |
| Mean | 84.5% | 84.6% |
| Median | 84.9% | 85.3% |
| Interquartile 25% (IQ1) | 83.5% | 82.1% |
| Interquartile 75% (IQ3) | 85.6% | 93.2% |
| Interquartile Range (IQR) | 2.1% | 11.0% |
| Standard Deviation (Sample) | 2.1% | 12.7% |
| Standard Deviation (Population) | 2.1% | 12.6% |
Demographics Similar to Asians and Ukrainians by In Labor Force | Age 35-44
In terms of in labor force | age 35-44, the demographic groups most similar to Asians are Slavic (84.7%, a difference of 0.0%), Maltese (84.7%, a difference of 0.0%), Immigrants from Spain (84.7%, a difference of 0.0%), Immigrants from Ghana (84.7%, a difference of 0.0%), and Finnish (84.7%, a difference of 0.010%). Similarly, the demographic groups most similar to Ukrainians are Immigrants from Western Africa (84.7%, a difference of 0.0%), Filipino (84.7%, a difference of 0.010%), Uruguayan (84.7%, a difference of 0.010%), Chilean (84.7%, a difference of 0.010%), and Bahamian (84.7%, a difference of 0.010%).
| Demographics | Rating | Rank | In Labor Force | Age 35-44 |
| Immigrants | Argentina | 94.5 /100 | #108 | Exceptional 84.8% |
| Immigrants | Russia | 94.5 /100 | #109 | Exceptional 84.8% |
| Filipinos | 93.8 /100 | #110 | Exceptional 84.7% |
| Ukrainians | 93.5 /100 | #111 | Exceptional 84.7% |
| Immigrants | Western Africa | 93.4 /100 | #112 | Exceptional 84.7% |
| Uruguayans | 93.3 /100 | #113 | Exceptional 84.7% |
| Chileans | 93.2 /100 | #114 | Exceptional 84.7% |
| Bahamians | 93.2 /100 | #115 | Exceptional 84.7% |
| Immigrants | Egypt | 92.7 /100 | #116 | Exceptional 84.7% |
| Immigrants | China | 92.3 /100 | #117 | Exceptional 84.7% |
| Immigrants | Eastern Asia | 92.1 /100 | #118 | Exceptional 84.7% |
| Burmese | 91.8 /100 | #119 | Exceptional 84.7% |
| Immigrants | Northern Europe | 91.5 /100 | #120 | Exceptional 84.7% |
| Finns | 91.2 /100 | #121 | Exceptional 84.7% |
| Germans | 91.0 /100 | #122 | Exceptional 84.7% |
| Immigrants | South America | 90.9 /100 | #123 | Exceptional 84.7% |
| Slavs | 90.8 /100 | #124 | Exceptional 84.7% |
| Maltese | 90.8 /100 | #125 | Exceptional 84.7% |
| Asians | 90.6 /100 | #126 | Exceptional 84.7% |
| Immigrants | Spain | 90.6 /100 | #127 | Exceptional 84.7% |
| Immigrants | Ghana | 90.4 /100 | #128 | Exceptional 84.7% |