Asian vs Guatemalan Unemployment Among Ages 20 to 24 years
COMPARE
Asian
Guatemalan
Unemployment Among Ages 20 to 24 years
Unemployment Among Ages 20 to 24 years Comparison
Asians
Guatemalans
10.2%
UNEMPLOYMENT AMONG AGES 20 TO 24 YEARS
77.7/ 100
METRIC RATING
146th/ 347
METRIC RANK
10.5%
UNEMPLOYMENT AMONG AGES 20 TO 24 YEARS
12.2/ 100
METRIC RATING
213th/ 347
METRIC RANK
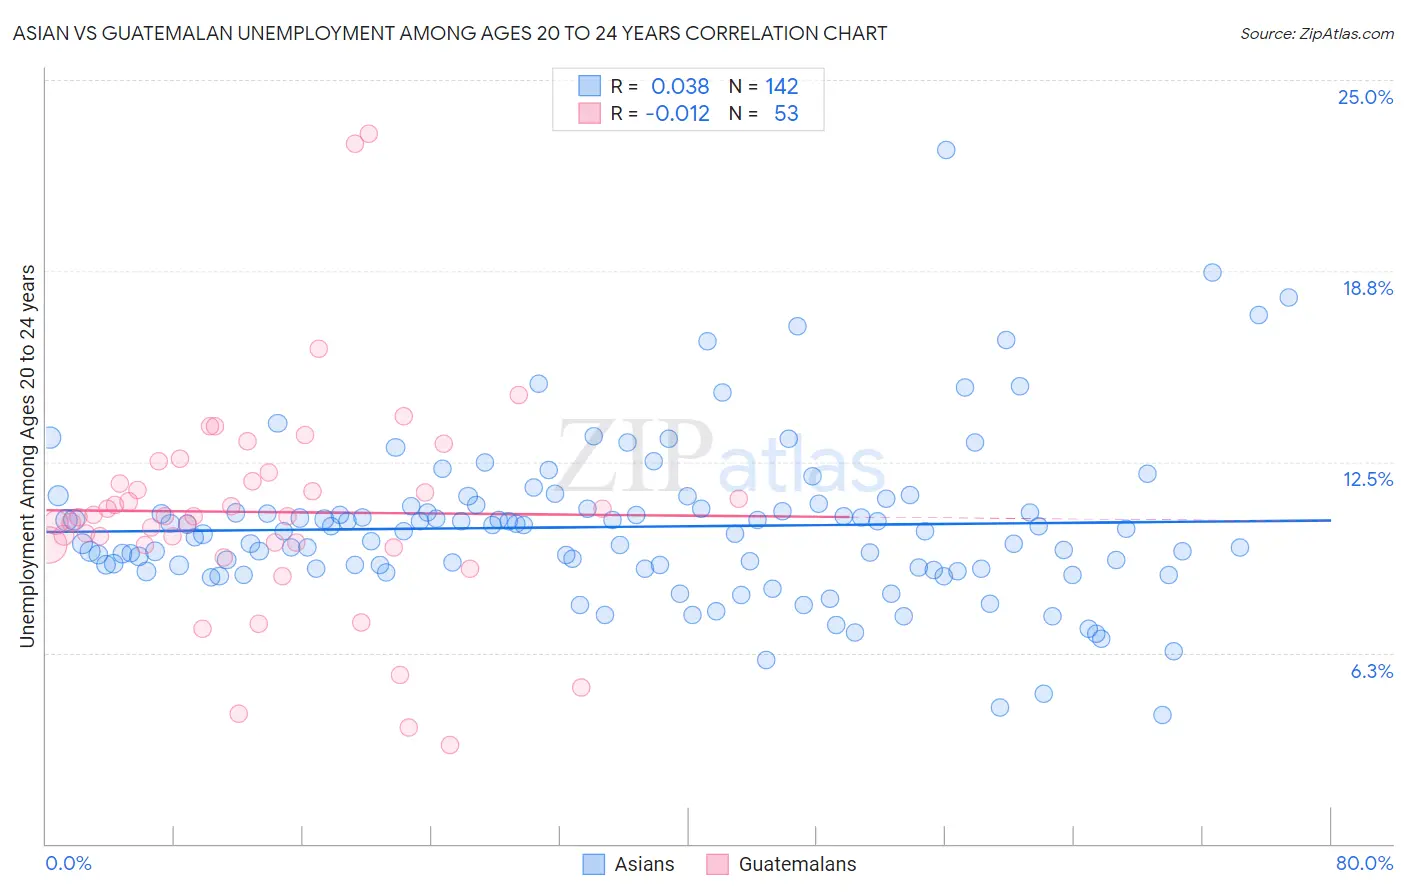
Asian vs Guatemalan Unemployment Among Ages 20 to 24 years Correlation Chart
The statistical analysis conducted on geographies consisting of 513,970,712 people shows no correlation between the proportion of Asians and unemployment rate among population between the ages 20 and 24 in the United States with a correlation coefficient (R) of 0.038 and weighted average of 10.2%. Similarly, the statistical analysis conducted on geographies consisting of 397,999,155 people shows no correlation between the proportion of Guatemalans and unemployment rate among population between the ages 20 and 24 in the United States with a correlation coefficient (R) of -0.012 and weighted average of 10.5%, a difference of 3.0%.
Unemployment Among Ages 20 to 24 years Correlation Summary
| Measurement | Asian | Guatemalan |
| Minimum | 4.2% | 3.2% |
| Maximum | 22.7% | 23.2% |
| Range | 18.5% | 20.0% |
| Mean | 10.4% | 10.9% |
| Median | 10.2% | 10.7% |
| Interquartile 25% (IQ1) | 9.0% | 9.8% |
| Interquartile 75% (IQ3) | 11.0% | 12.0% |
| Interquartile Range (IQR) | 2.0% | 2.2% |
| Standard Deviation (Sample) | 2.6% | 3.6% |
| Standard Deviation (Population) | 2.6% | 3.5% |
Similar Demographics by Unemployment Among Ages 20 to 24 years
Demographics Similar to Asians by Unemployment Among Ages 20 to 24 years
In terms of unemployment among ages 20 to 24 years, the demographic groups most similar to Asians are French Canadian (10.2%, a difference of 0.010%), Argentinean (10.2%, a difference of 0.020%), Brazilian (10.2%, a difference of 0.040%), Immigrants from Jordan (10.2%, a difference of 0.070%), and Immigrants from Romania (10.2%, a difference of 0.10%).
| Demographics | Rating | Rank | Unemployment Among Ages 20 to 24 years |
| Uruguayans | 81.9 /100 | #139 | Excellent 10.2% |
| Immigrants | Austria | 81.4 /100 | #140 | Excellent 10.2% |
| Immigrants | Azores | 81.4 /100 | #141 | Excellent 10.2% |
| Slovaks | 80.2 /100 | #142 | Excellent 10.2% |
| Immigrants | Jordan | 79.0 /100 | #143 | Good 10.2% |
| Brazilians | 78.4 /100 | #144 | Good 10.2% |
| Argentineans | 78.0 /100 | #145 | Good 10.2% |
| Asians | 77.7 /100 | #146 | Good 10.2% |
| French Canadians | 77.5 /100 | #147 | Good 10.2% |
| Immigrants | Romania | 75.7 /100 | #148 | Good 10.2% |
| Immigrants | Scotland | 74.6 /100 | #149 | Good 10.2% |
| Hungarians | 74.4 /100 | #150 | Good 10.2% |
| Immigrants | South Africa | 73.6 /100 | #151 | Good 10.2% |
| Iranians | 72.4 /100 | #152 | Good 10.2% |
| Immigrants | Taiwan | 71.4 /100 | #153 | Good 10.2% |
Demographics Similar to Guatemalans by Unemployment Among Ages 20 to 24 years
In terms of unemployment among ages 20 to 24 years, the demographic groups most similar to Guatemalans are Kiowa (10.5%, a difference of 0.040%), Immigrants from Sri Lanka (10.5%, a difference of 0.14%), Honduran (10.5%, a difference of 0.15%), Immigrants from Guatemala (10.5%, a difference of 0.19%), and Costa Rican (10.5%, a difference of 0.24%).
| Demographics | Rating | Rank | Unemployment Among Ages 20 to 24 years |
| Immigrants | Europe | 18.5 /100 | #206 | Poor 10.4% |
| Immigrants | Honduras | 17.9 /100 | #207 | Poor 10.4% |
| Immigrants | Hong Kong | 17.6 /100 | #208 | Poor 10.5% |
| Peruvians | 17.2 /100 | #209 | Poor 10.5% |
| Immigrants | Belgium | 16.9 /100 | #210 | Poor 10.5% |
| Immigrants | Guatemala | 14.6 /100 | #211 | Poor 10.5% |
| Immigrants | Sri Lanka | 14.0 /100 | #212 | Poor 10.5% |
| Guatemalans | 12.2 /100 | #213 | Poor 10.5% |
| Kiowa | 11.7 /100 | #214 | Poor 10.5% |
| Hondurans | 10.5 /100 | #215 | Poor 10.5% |
| Costa Ricans | 9.6 /100 | #216 | Tragic 10.5% |
| Cherokee | 9.3 /100 | #217 | Tragic 10.5% |
| Immigrants | Nonimmigrants | 8.8 /100 | #218 | Tragic 10.5% |
| Immigrants | Southern Europe | 8.0 /100 | #219 | Tragic 10.5% |
| Eastern Europeans | 6.9 /100 | #220 | Tragic 10.6% |