Chinese vs Immigrants from India In Labor Force | Age 35-44
COMPARE
Chinese
Immigrants from India
In Labor Force | Age 35-44
In Labor Force | Age 35-44 Comparison
Chinese
Immigrants from India
85.1%
IN LABOR FORCE | AGE 35-44
99.4/ 100
METRIC RATING
57th/ 347
METRIC RANK
85.3%
IN LABOR FORCE | AGE 35-44
99.9/ 100
METRIC RATING
32nd/ 347
METRIC RANK
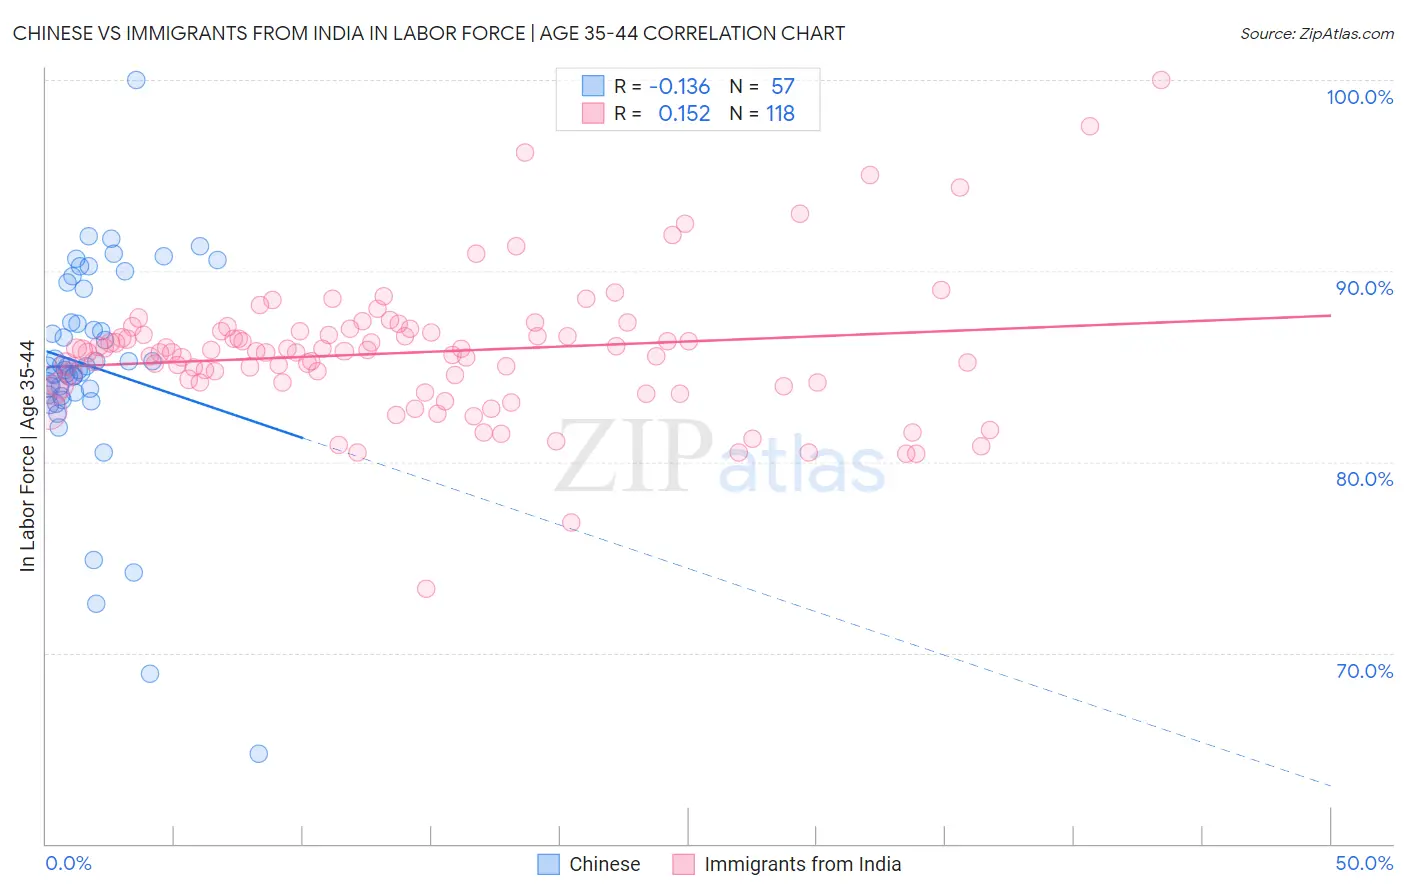
Chinese vs Immigrants from India In Labor Force | Age 35-44 Correlation Chart
The statistical analysis conducted on geographies consisting of 64,807,570 people shows a poor negative correlation between the proportion of Chinese and labor force participation rate among population between the ages 35 and 44 in the United States with a correlation coefficient (R) of -0.136 and weighted average of 85.1%. Similarly, the statistical analysis conducted on geographies consisting of 433,829,652 people shows a poor positive correlation between the proportion of Immigrants from India and labor force participation rate among population between the ages 35 and 44 in the United States with a correlation coefficient (R) of 0.152 and weighted average of 85.3%, a difference of 0.27%.
In Labor Force | Age 35-44 Correlation Summary
| Measurement | Chinese | Immigrants from India |
| Minimum | 64.7% | 73.3% |
| Maximum | 100.0% | 100.0% |
| Range | 35.3% | 26.7% |
| Mean | 85.0% | 85.7% |
| Median | 85.0% | 85.8% |
| Interquartile 25% (IQ1) | 83.6% | 84.1% |
| Interquartile 75% (IQ3) | 88.2% | 86.8% |
| Interquartile Range (IQR) | 4.6% | 2.7% |
| Standard Deviation (Sample) | 5.6% | 3.6% |
| Standard Deviation (Population) | 5.6% | 3.6% |
Similar Demographics by In Labor Force | Age 35-44
Demographics Similar to Chinese by In Labor Force | Age 35-44
In terms of in labor force | age 35-44, the demographic groups most similar to Chinese are Slovak (85.1%, a difference of 0.010%), Serbian (85.1%, a difference of 0.010%), Albanian (85.1%, a difference of 0.010%), Immigrants from Croatia (85.1%, a difference of 0.020%), and Turkish (85.1%, a difference of 0.030%).
| Demographics | Rating | Rank | In Labor Force | Age 35-44 |
| Thais | 99.7 /100 | #50 | Exceptional 85.2% |
| Immigrants | Albania | 99.7 /100 | #51 | Exceptional 85.1% |
| Immigrants | Kenya | 99.6 /100 | #52 | Exceptional 85.1% |
| Taiwanese | 99.6 /100 | #53 | Exceptional 85.1% |
| Turks | 99.5 /100 | #54 | Exceptional 85.1% |
| Soviet Union | 99.5 /100 | #55 | Exceptional 85.1% |
| Immigrants | Croatia | 99.5 /100 | #56 | Exceptional 85.1% |
| Chinese | 99.4 /100 | #57 | Exceptional 85.1% |
| Slovaks | 99.4 /100 | #58 | Exceptional 85.1% |
| Serbians | 99.4 /100 | #59 | Exceptional 85.1% |
| Albanians | 99.4 /100 | #60 | Exceptional 85.1% |
| Immigrants | Latvia | 99.3 /100 | #61 | Exceptional 85.0% |
| Immigrants | Moldova | 99.3 /100 | #62 | Exceptional 85.0% |
| Immigrants | Uganda | 99.3 /100 | #63 | Exceptional 85.0% |
| Swedes | 99.2 /100 | #64 | Exceptional 85.0% |
Demographics Similar to Immigrants from India by In Labor Force | Age 35-44
In terms of in labor force | age 35-44, the demographic groups most similar to Immigrants from India are Bermudan (85.3%, a difference of 0.0%), Czech (85.3%, a difference of 0.0%), Ugandan (85.3%, a difference of 0.010%), Cambodian (85.3%, a difference of 0.020%), and Immigrants from Nepal (85.3%, a difference of 0.030%).
| Demographics | Rating | Rank | In Labor Force | Age 35-44 |
| Paraguayans | 99.9 /100 | #25 | Exceptional 85.4% |
| Immigrants | Liberia | 99.9 /100 | #26 | Exceptional 85.4% |
| Immigrants | Lithuania | 99.9 /100 | #27 | Exceptional 85.4% |
| Immigrants | Greece | 99.9 /100 | #28 | Exceptional 85.3% |
| Cambodians | 99.9 /100 | #29 | Exceptional 85.3% |
| Bermudans | 99.9 /100 | #30 | Exceptional 85.3% |
| Czechs | 99.9 /100 | #31 | Exceptional 85.3% |
| Immigrants | India | 99.9 /100 | #32 | Exceptional 85.3% |
| Ugandans | 99.9 /100 | #33 | Exceptional 85.3% |
| Immigrants | Nepal | 99.9 /100 | #34 | Exceptional 85.3% |
| Estonians | 99.9 /100 | #35 | Exceptional 85.3% |
| Immigrants | Morocco | 99.8 /100 | #36 | Exceptional 85.2% |
| Kenyans | 99.8 /100 | #37 | Exceptional 85.2% |
| Immigrants | Poland | 99.8 /100 | #38 | Exceptional 85.2% |
| Eastern Europeans | 99.8 /100 | #39 | Exceptional 85.2% |