Armenian vs Austrian In Labor Force | Age 35-44

COMPARE

Armenian
Race
Ancestry
AfghanAfricanAlaska NativeAlaskan AthabascanAlbanianAleutAlsatianAmericanApacheArabArapahoArgentineanArmenianAssyrian/Chaldean/SyriacAustralianBahamianBangladeshiBarbadianBasqueBelgianBelizeanBermudanBhutaneseBlackfeetBolivianBrazilianBritishBritish West IndianBulgarianBurmeseCajunCambodianCanadianCape VerdeanCarpatho RusynCelticCentral AmericanCentral American IndianCherokeeCheyenneChickasawChileanChineseChippewaChoctawColombianColvilleComancheCosta RicanCreeCreekCroatianCrowCubanCypriotCzechCzechoslovakianDanishDelawareDominicanDutchDutch West IndianEastern EuropeanEcuadorianEgyptianEnglishEstonianEthiopianEuropeanFijianFilipinoFinnishFrenchFrench American IndianFrench CanadianGermanGerman RussianGhanaianGreekGuamanian/ChamorroGuatemalanGuyaneseHaitianHmongHonduranHopiHoumaHungarianIcelanderIndian (Asian)IndonesianInupiatIranianIraqiIrishIroquoisIsraeliItalianJamaicanJapaneseJordanianKenyanKiowaKoreanLaotianLatvianLebaneseLiberianLithuanianLumbeeLuxembourgerMacedonianMalaysianMalteseMarshalleseMenomineeMexicanMexican American IndianMongolianMoroccanNative HawaiianNavajoNepaleseNew ZealanderNicaraguanNigerianNorthern EuropeanNorwegianOkinawanOsageOttawaPaiutePakistaniPalestinianPanamanianParaguayanPennsylvania GermanPeruvianPimaPolishPortuguesePotawatomiPuebloPuerto RicanPuget Sound SalishRomanianRussianSalvadoranSamoanScandinavianScotch-IrishScottishSeminoleSenegaleseSerbianShoshoneSierra LeoneanSiouxSlavicSlovakSloveneSomaliSouth AfricanSouth AmericanSouth American IndianSoviet UnionSpaniardSpanishSpanish AmericanSpanish American IndianSri LankanSubsaharan AfricanSudaneseSwedishSwissSyrianTaiwaneseThaiTlingit-HaidaTohono O'OdhamTonganTrinidadian and TobagonianTsimshianTurkishU.S. Virgin IslanderUgandanUkrainianUruguayanUteVenezuelanVietnameseWelshWest IndianYakamaYaquiYugoslavianYumanYup'ikZimbabwean
Immigration
NonimmigrantsImmigrantsAfghanistanAfricaAlbaniaArgentinaArmeniaAsiaAustraliaAustriaBahamasBangladeshBarbadosBelarusBelgiumBelizeBoliviaBosnia and HerzegovinaBrazilBulgariaBurma/MyanmarCabo VerdeCambodiaCameroonCanadaCaribbeanCentral AmericaChileChinaColombiaCongoCosta RicaCroatiaCubaCzechoslovakiaDenmarkDominicaDominican RepublicEastern AfricaEastern AsiaEastern EuropeEcuadorEgyptEl SalvadorEnglandEritreaEthiopiaEuropeFijiFranceGermanyGhanaGreeceGrenadaGuatemalaGuyanaHaitiHondurasHong KongHungaryIndiaIndonesiaIranIraqIrelandIsraelItalyJamaicaJapanJordanKazakhstanKenyaKoreaKuwaitLaosLatin AmericaLatviaLebanonLiberiaLithuaniaMalaysiaMexicoMicronesiaMiddle AfricaMoldovaMoroccoNepalNetherlandsNicaraguaNigeriaNorth AmericaNorth MacedoniaNorthern AfricaNorthern EuropeNorwayOceaniaPakistanPanamaPeruPhilippinesPolandPortugalRomaniaRussiaSaudi ArabiaScotlandSenegalSerbiaSierra LeoneSingaporeSomaliaSouth AfricaSouth AmericaSouth Central AsiaSouth Eastern AsiaSouthern EuropeSpainSri LankaSt. Vincent and the GrenadinesSudanSwedenSwitzerlandSyriaTaiwanThailandTrinidad and TobagoTurkeyUgandaUkraineUruguayUzbekistanVenezuelaVietnamWest IndiesWestern AfricaWestern AsiaWestern EuropeYemenZaireZimbabweAzores
Austrian
Race
Ancestry
AfghanAfricanAlaska NativeAlaskan AthabascanAlbanianAleutAlsatianAmericanApacheArabArapahoArgentineanAssyrian/Chaldean/SyriacAustralianAustrianBahamianBangladeshiBarbadianBasqueBelgianBelizeanBermudanBhutaneseBlackfeetBolivianBrazilianBritishBritish West IndianBulgarianBurmeseCajunCambodianCanadianCape VerdeanCarpatho RusynCelticCentral AmericanCentral American IndianCherokeeCheyenneChickasawChileanChineseChippewaChoctawColombianColvilleComancheCosta RicanCreeCreekCroatianCrowCubanCypriotCzechCzechoslovakianDanishDelawareDominicanDutchDutch West IndianEastern EuropeanEcuadorianEgyptianEnglishEstonianEthiopianEuropeanFijianFilipinoFinnishFrenchFrench American IndianFrench CanadianGermanGerman RussianGhanaianGreekGuamanian/ChamorroGuatemalanGuyaneseHaitianHmongHonduranHopiHoumaHungarianIcelanderIndian (Asian)IndonesianInupiatIranianIraqiIrishIroquoisIsraeliItalianJamaicanJapaneseJordanianKenyanKiowaKoreanLaotianLatvianLebaneseLiberianLithuanianLumbeeLuxembourgerMacedonianMalaysianMalteseMarshalleseMenomineeMexicanMexican American IndianMongolianMoroccanNative HawaiianNavajoNepaleseNew ZealanderNicaraguanNigerianNorthern EuropeanNorwegianOkinawanOsageOttawaPaiutePakistaniPalestinianPanamanianParaguayanPennsylvania GermanPeruvianPimaPolishPortuguesePotawatomiPuebloPuerto RicanPuget Sound SalishRomanianRussianSalvadoranSamoanScandinavianScotch-IrishScottishSeminoleSenegaleseSerbianShoshoneSierra LeoneanSiouxSlavicSlovakSloveneSomaliSouth AfricanSouth AmericanSouth American IndianSoviet UnionSpaniardSpanishSpanish AmericanSpanish American IndianSri LankanSubsaharan AfricanSudaneseSwedishSwissSyrianTaiwaneseThaiTlingit-HaidaTohono O'OdhamTonganTrinidadian and TobagonianTsimshianTurkishU.S. Virgin IslanderUgandanUkrainianUruguayanUteVenezuelanVietnameseWelshWest IndianYakamaYaquiYugoslavianYumanYup'ikZimbabwean
Immigration
NonimmigrantsImmigrantsAfghanistanAfricaAlbaniaArgentinaArmeniaAsiaAustraliaAustriaBahamasBangladeshBarbadosBelarusBelgiumBelizeBoliviaBosnia and HerzegovinaBrazilBulgariaBurma/MyanmarCabo VerdeCambodiaCameroonCanadaCaribbeanCentral AmericaChileChinaColombiaCongoCosta RicaCroatiaCubaCzechoslovakiaDenmarkDominicaDominican RepublicEastern AfricaEastern AsiaEastern EuropeEcuadorEgyptEl SalvadorEnglandEritreaEthiopiaEuropeFijiFranceGermanyGhanaGreeceGrenadaGuatemalaGuyanaHaitiHondurasHong KongHungaryIndiaIndonesiaIranIraqIrelandIsraelItalyJamaicaJapanJordanKazakhstanKenyaKoreaKuwaitLaosLatin AmericaLatviaLebanonLiberiaLithuaniaMalaysiaMexicoMicronesiaMiddle AfricaMoldovaMoroccoNepalNetherlandsNicaraguaNigeriaNorth AmericaNorth MacedoniaNorthern AfricaNorthern EuropeNorwayOceaniaPakistanPanamaPeruPhilippinesPolandPortugalRomaniaRussiaSaudi ArabiaScotlandSenegalSerbiaSierra LeoneSingaporeSomaliaSouth AfricaSouth AmericaSouth Central AsiaSouth Eastern AsiaSouthern EuropeSpainSri LankaSt. Vincent and the GrenadinesSudanSwedenSwitzerlandSyriaTaiwanThailandTrinidad and TobagoTurkeyUgandaUkraineUruguayUzbekistanVenezuelaVietnamWest IndiesWestern AfricaWestern AsiaWestern EuropeYemenZaireZimbabweAzores
In Labor Force | Age 35-44
Income
Poverty
Unemployment
Labor Participation
Family Structure
Vehicle Availability
Education Level
Disability

In Labor Force | Age 35-44 Comparison

Armenians

Austrians

Fair
Excellent
84.3%
IN LABOR FORCE | AGE 35-44
35.6/ 100
METRIC RATING
184th/ 347
METRIC RANK
84.7%
IN LABOR FORCE | AGE 35-44
89.4/ 100
METRIC RATING
132nd/ 347
METRIC RANK

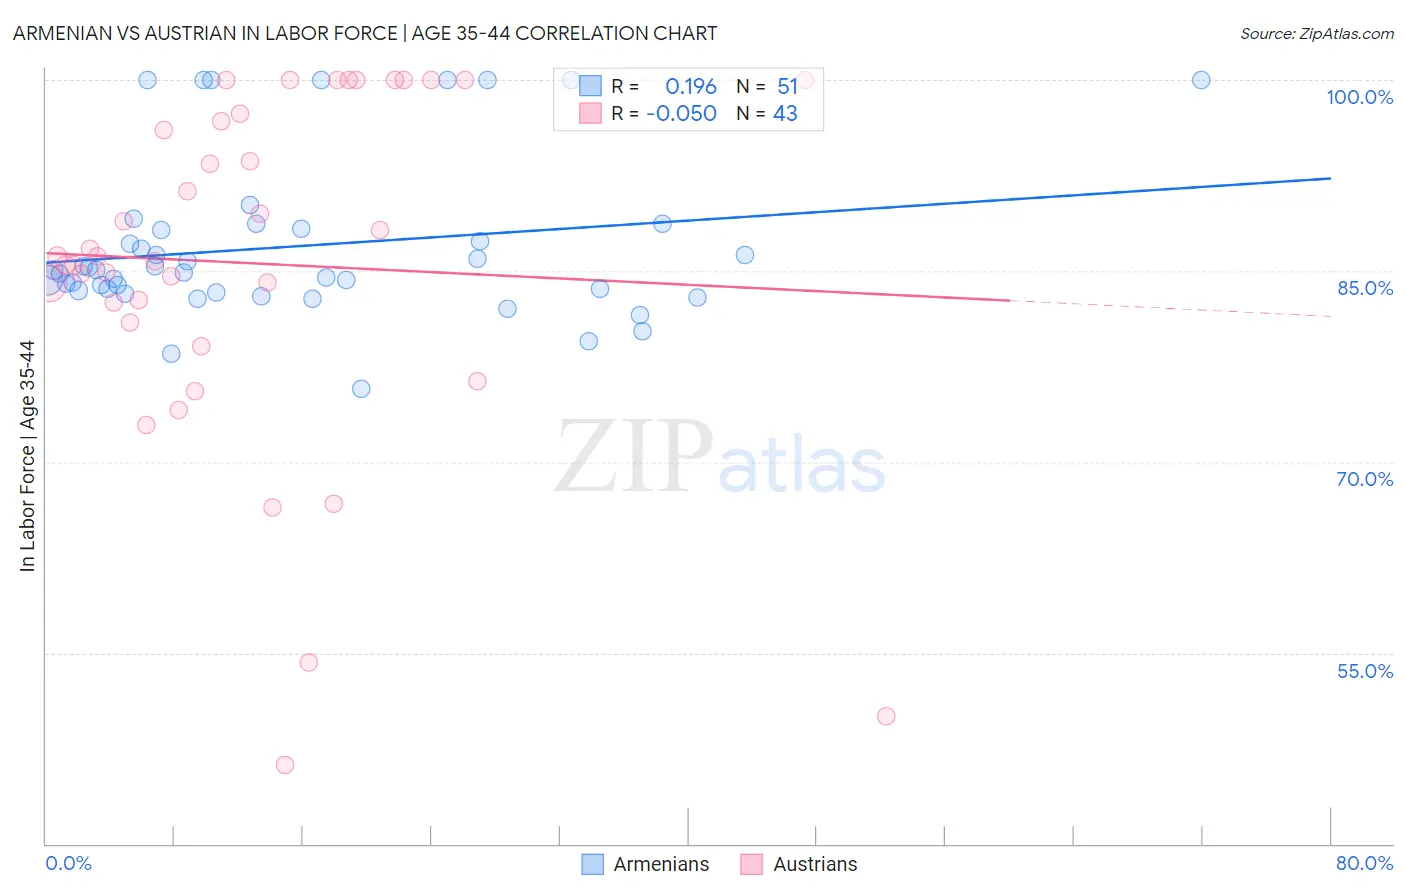
Armenian vs Austrian In Labor Force | Age 35-44 Correlation Chart

The statistical analysis conducted on geographies consisting of 310,840,291 people shows a poor positive correlation between the proportion of Armenians and labor force participation rate among population between the ages 35 and 44 in the United States with a correlation coefficient (R) of 0.196 and weighted average of 84.3%. Similarly, the statistical analysis conducted on geographies consisting of 451,816,853 people shows a slight negative correlation between the proportion of Austrians and labor force participation rate among population between the ages 35 and 44 in the United States with a correlation coefficient (R) of -0.050 and weighted average of 84.7%, a difference of 0.44%.
Armenian vs Austrian In Labor Force | Age 35-44

In Labor Force | Age 35-44 Correlation Summary

MeasurementArmenianAustrian
Minimum75.7%46.2%
Maximum100.0%100.0%
Range24.3%53.8%
Mean86.9%85.6%
Median85.0%86.1%
Interquartile 25% (IQ1)83.5%81.0%
Interquartile 75% (IQ3)88.3%97.4%
Interquartile Range (IQR)4.9%16.4%
Standard Deviation (Sample)6.3%13.6%
Standard Deviation (Population)6.2%13.4%

Similar Demographics by In Labor Force | Age 35-44

Demographics Similar to Armenians by In Labor Force | Age 35-44

In terms of in labor force | age 35-44, the demographic groups most similar to Armenians are Barbadian (84.3%, a difference of 0.0%), Costa Rican (84.3%, a difference of 0.0%), Australian (84.3%, a difference of 0.0%), Immigrants from West Indies (84.3%, a difference of 0.010%), and Korean (84.3%, a difference of 0.010%).
DemographicsRating | RankIn Labor Force | Age 35-44
French Canadians
44.3
/100
|
#177
Average
84.3%
Northern Europeans
44.1
/100
|
#178
Average
84.3%
Immigrants | South Africa
42.8
/100
|
#179
Average
84.3%
Danes
38.8
/100
|
#180
Fair
84.3%
Immigrants | West Indies
36.4
/100
|
#181
Fair
84.3%
Koreans
36.3
/100
|
#182
Fair
84.3%
Barbadians
36.2
/100
|
#183
Fair
84.3%
Armenians
35.6
/100
|
#184
Fair
84.3%
Costa Ricans
35.3
/100
|
#185
Fair
84.3%
Australians
35.1
/100
|
#186
Fair
84.3%
Dutch
34.8
/100
|
#187
Fair
84.3%
South Africans
34.1
/100
|
#188
Fair
84.3%
Immigrants | Denmark
33.7
/100
|
#189
Fair
84.3%
Portuguese
31.9
/100
|
#190
Fair
84.3%
Immigrants | Philippines
27.9
/100
|
#191
Fair
84.2%

Demographics Similar to Austrians by In Labor Force | Age 35-44

In terms of in labor force | age 35-44, the demographic groups most similar to Austrians are Palestinian (84.7%, a difference of 0.0%), Bhutanese (84.7%, a difference of 0.0%), Immigrants from Scotland (84.7%, a difference of 0.0%), Maltese (84.7%, a difference of 0.020%), and Asian (84.7%, a difference of 0.020%).
DemographicsRating | RankIn Labor Force | Age 35-44
Maltese
90.8
/100
|
#125
Exceptional
84.7%
Asians
90.6
/100
|
#126
Exceptional
84.7%
Immigrants | Spain
90.6
/100
|
#127
Exceptional
84.7%
Immigrants | Ghana
90.4
/100
|
#128
Exceptional
84.7%
Palestinians
89.7
/100
|
#129
Excellent
84.7%
Bhutanese
89.7
/100
|
#130
Excellent
84.7%
Immigrants | Scotland
89.6
/100
|
#131
Excellent
84.7%
Austrians
89.4
/100
|
#132
Excellent
84.7%
Argentineans
88.4
/100
|
#133
Excellent
84.6%
Immigrants | Korea
88.2
/100
|
#134
Excellent
84.6%
Immigrants | Malaysia
87.5
/100
|
#135
Excellent
84.6%
Afghans
86.3
/100
|
#136
Excellent
84.6%
Immigrants | Chile
84.6
/100
|
#137
Excellent
84.6%
Czechoslovakians
82.6
/100
|
#138
Excellent
84.6%
Immigrants | Zaire
82.5
/100
|
#139
Excellent
84.6%