Armenian vs Tohono O'odham In Labor Force | Age 35-44
COMPARE
Armenian
Tohono O'odham
In Labor Force | Age 35-44
In Labor Force | Age 35-44 Comparison
Armenians
Tohono O'odham
84.3%
IN LABOR FORCE | AGE 35-44
35.6/ 100
METRIC RATING
184th/ 347
METRIC RANK
74.1%
IN LABOR FORCE | AGE 35-44
0.0/ 100
METRIC RATING
346th/ 347
METRIC RANK
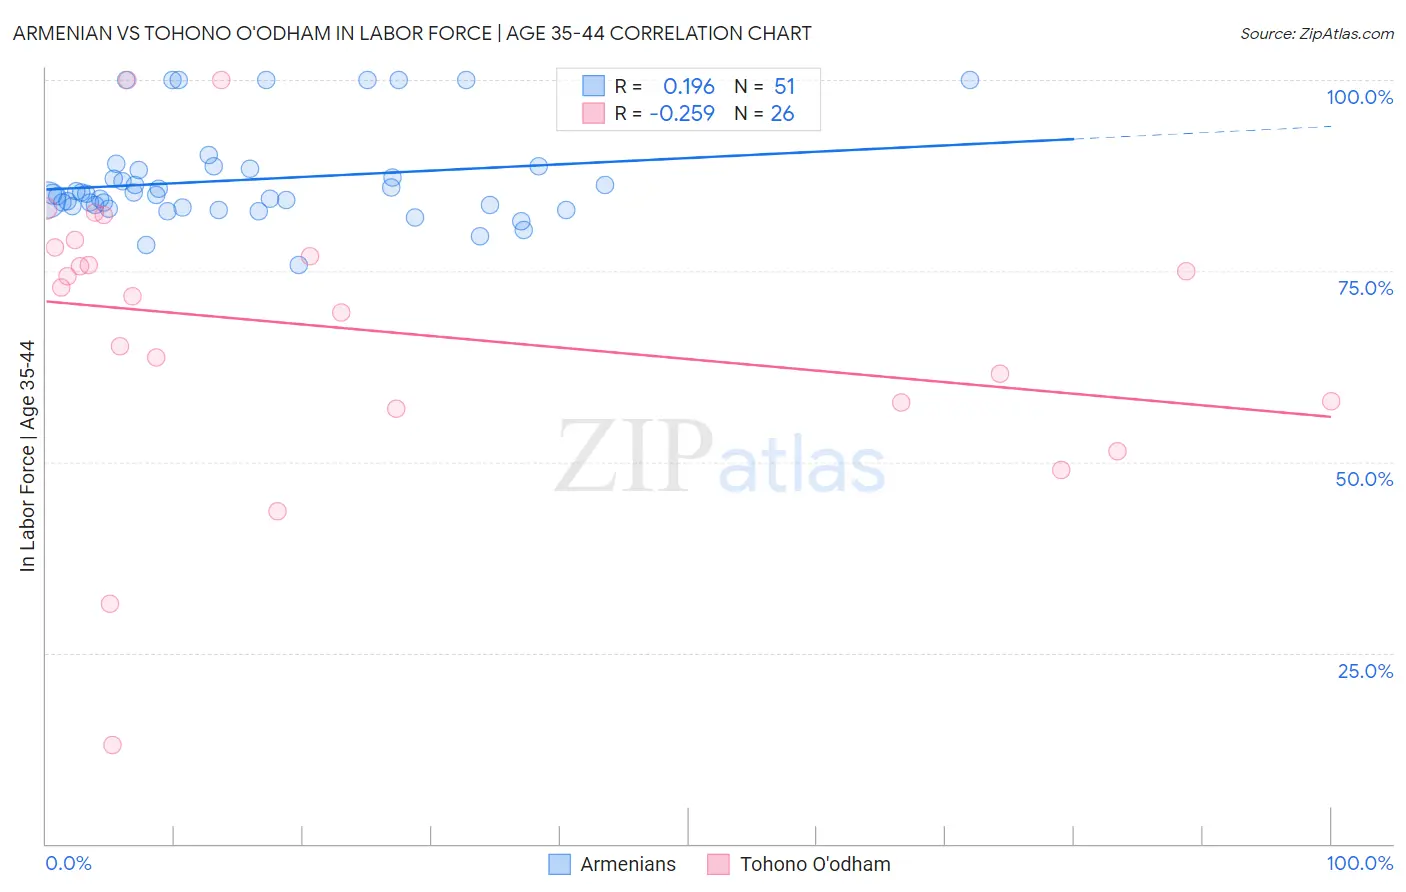
Armenian vs Tohono O'odham In Labor Force | Age 35-44 Correlation Chart
The statistical analysis conducted on geographies consisting of 310,840,291 people shows a poor positive correlation between the proportion of Armenians and labor force participation rate among population between the ages 35 and 44 in the United States with a correlation coefficient (R) of 0.196 and weighted average of 84.3%. Similarly, the statistical analysis conducted on geographies consisting of 58,719,465 people shows a weak negative correlation between the proportion of Tohono O'odham and labor force participation rate among population between the ages 35 and 44 in the United States with a correlation coefficient (R) of -0.259 and weighted average of 74.1%, a difference of 13.7%.
In Labor Force | Age 35-44 Correlation Summary
| Measurement | Armenian | Tohono O'odham |
| Minimum | 75.7% | 13.0% |
| Maximum | 100.0% | 100.0% |
| Range | 24.3% | 87.0% |
| Mean | 86.9% | 67.2% |
| Median | 85.0% | 72.2% |
| Interquartile 25% (IQ1) | 83.5% | 57.8% |
| Interquartile 75% (IQ3) | 88.3% | 78.1% |
| Interquartile Range (IQR) | 4.9% | 20.3% |
| Standard Deviation (Sample) | 6.3% | 19.2% |
| Standard Deviation (Population) | 6.2% | 18.8% |
Similar Demographics by In Labor Force | Age 35-44
Demographics Similar to Armenians by In Labor Force | Age 35-44
In terms of in labor force | age 35-44, the demographic groups most similar to Armenians are Barbadian (84.3%, a difference of 0.0%), Costa Rican (84.3%, a difference of 0.0%), Australian (84.3%, a difference of 0.0%), Immigrants from West Indies (84.3%, a difference of 0.010%), and Korean (84.3%, a difference of 0.010%).
| Demographics | Rating | Rank | In Labor Force | Age 35-44 |
| French Canadians | 44.3 /100 | #177 | Average 84.3% |
| Northern Europeans | 44.1 /100 | #178 | Average 84.3% |
| Immigrants | South Africa | 42.8 /100 | #179 | Average 84.3% |
| Danes | 38.8 /100 | #180 | Fair 84.3% |
| Immigrants | West Indies | 36.4 /100 | #181 | Fair 84.3% |
| Koreans | 36.3 /100 | #182 | Fair 84.3% |
| Barbadians | 36.2 /100 | #183 | Fair 84.3% |
| Armenians | 35.6 /100 | #184 | Fair 84.3% |
| Costa Ricans | 35.3 /100 | #185 | Fair 84.3% |
| Australians | 35.1 /100 | #186 | Fair 84.3% |
| Dutch | 34.8 /100 | #187 | Fair 84.3% |
| South Africans | 34.1 /100 | #188 | Fair 84.3% |
| Immigrants | Denmark | 33.7 /100 | #189 | Fair 84.3% |
| Portuguese | 31.9 /100 | #190 | Fair 84.3% |
| Immigrants | Philippines | 27.9 /100 | #191 | Fair 84.2% |
Demographics Similar to Tohono O'odham by In Labor Force | Age 35-44
In terms of in labor force | age 35-44, the demographic groups most similar to Tohono O'odham are Navajo (73.8%, a difference of 0.38%), Yuman (74.7%, a difference of 0.83%), Pima (74.8%, a difference of 0.96%), Immigrants from Yemen (76.3%, a difference of 2.9%), and Crow (76.5%, a difference of 3.2%).
| Demographics | Rating | Rank | In Labor Force | Age 35-44 |
| Kiowa | 0.0 /100 | #333 | Tragic 79.2% |
| Yakama | 0.0 /100 | #334 | Tragic 79.0% |
| Natives/Alaskans | 0.0 /100 | #335 | Tragic 78.9% |
| Arapaho | 0.0 /100 | #336 | Tragic 78.1% |
| Apache | 0.0 /100 | #337 | Tragic 77.9% |
| Pueblo | 0.0 /100 | #338 | Tragic 77.4% |
| Yup'ik | 0.0 /100 | #339 | Tragic 77.3% |
| Lumbee | 0.0 /100 | #340 | Tragic 77.0% |
| Hopi | 0.0 /100 | #341 | Tragic 77.0% |
| Crow | 0.0 /100 | #342 | Tragic 76.5% |
| Immigrants | Yemen | 0.0 /100 | #343 | Tragic 76.3% |
| Pima | 0.0 /100 | #344 | Tragic 74.8% |
| Yuman | 0.0 /100 | #345 | Tragic 74.7% |
| Tohono O'odham | 0.0 /100 | #346 | Tragic 74.1% |
| Navajo | 0.0 /100 | #347 | Tragic 73.8% |