Arab vs Immigrants from Spain In Labor Force | Age 25-29
COMPARE
Arab
Immigrants from Spain
In Labor Force | Age 25-29
In Labor Force | Age 25-29 Comparison
Arabs
Immigrants from Spain
84.2%
IN LABOR FORCE | AGE 25-29
6.8/ 100
METRIC RATING
221st/ 347
METRIC RANK
84.7%
IN LABOR FORCE | AGE 25-29
56.9/ 100
METRIC RATING
166th/ 347
METRIC RANK
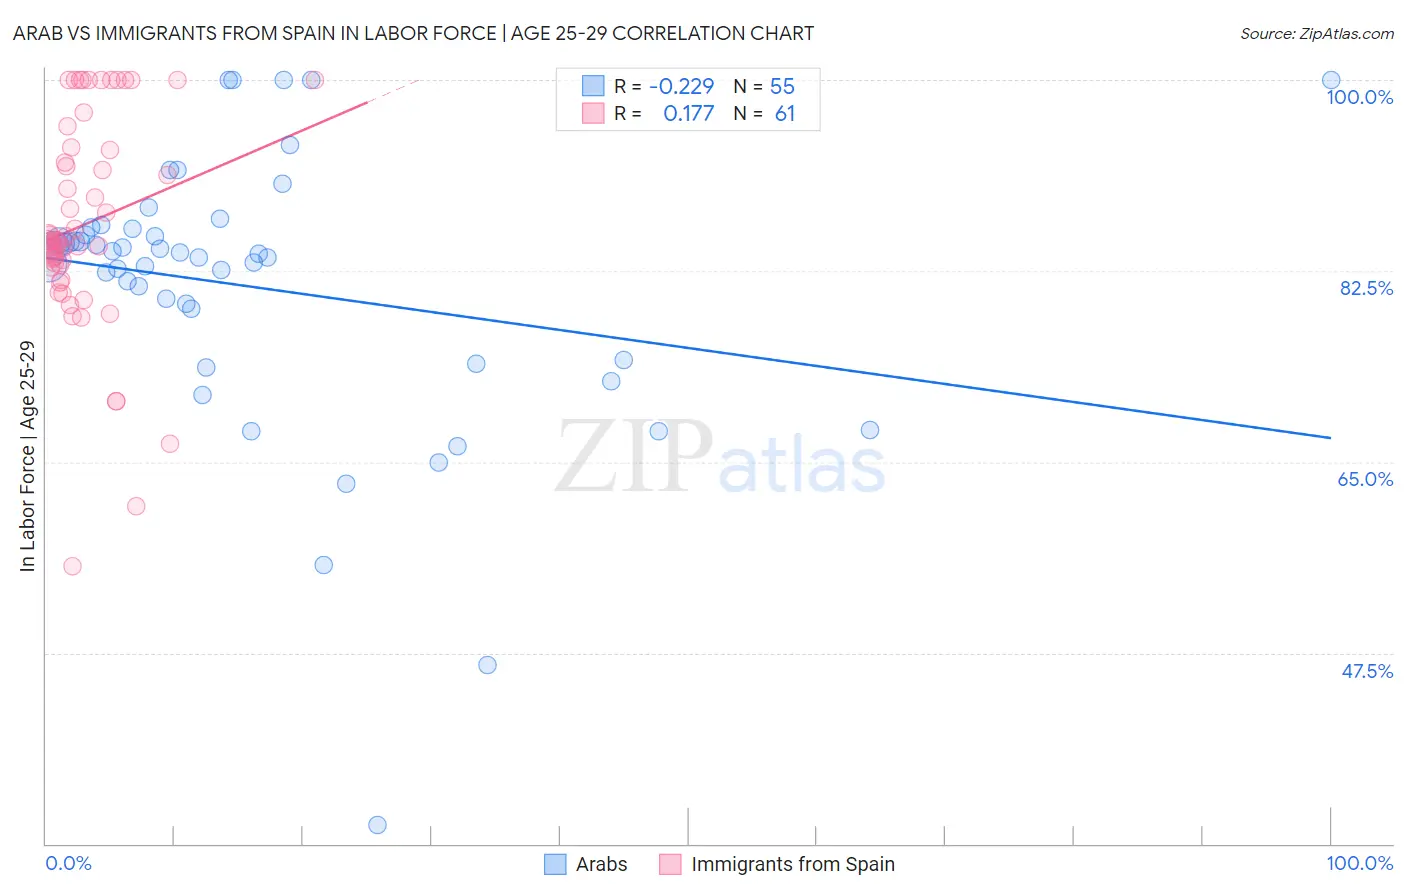
Arab vs Immigrants from Spain In Labor Force | Age 25-29 Correlation Chart
The statistical analysis conducted on geographies consisting of 486,557,270 people shows a weak negative correlation between the proportion of Arabs and labor force participation rate among population between the ages 25 and 29 in the United States with a correlation coefficient (R) of -0.229 and weighted average of 84.2%. Similarly, the statistical analysis conducted on geographies consisting of 239,645,733 people shows a poor positive correlation between the proportion of Immigrants from Spain and labor force participation rate among population between the ages 25 and 29 in the United States with a correlation coefficient (R) of 0.177 and weighted average of 84.7%, a difference of 0.54%.
In Labor Force | Age 25-29 Correlation Summary
| Measurement | Arab | Immigrants from Spain |
| Minimum | 31.7% | 55.5% |
| Maximum | 100.0% | 100.0% |
| Range | 68.3% | 44.5% |
| Mean | 81.0% | 86.8% |
| Median | 84.1% | 85.3% |
| Interquartile 25% (IQ1) | 74.3% | 82.9% |
| Interquartile 75% (IQ3) | 86.4% | 93.7% |
| Interquartile Range (IQR) | 12.1% | 10.8% |
| Standard Deviation (Sample) | 12.7% | 9.7% |
| Standard Deviation (Population) | 12.5% | 9.6% |
Similar Demographics by In Labor Force | Age 25-29
Demographics Similar to Arabs by In Labor Force | Age 25-29
In terms of in labor force | age 25-29, the demographic groups most similar to Arabs are Jordanian (84.2%, a difference of 0.0%), Nigerian (84.3%, a difference of 0.010%), Scotch-Irish (84.2%, a difference of 0.010%), Immigrants from West Indies (84.2%, a difference of 0.020%), and Korean (84.2%, a difference of 0.030%).
| Demographics | Rating | Rank | In Labor Force | Age 25-29 |
| Lebanese | 11.1 /100 | #214 | Poor 84.3% |
| Immigrants | Syria | 10.7 /100 | #215 | Poor 84.3% |
| Israelis | 9.3 /100 | #216 | Tragic 84.3% |
| Immigrants | Ecuador | 9.3 /100 | #217 | Tragic 84.3% |
| Immigrants | Nigeria | 9.0 /100 | #218 | Tragic 84.3% |
| Immigrants | Saudi Arabia | 8.8 /100 | #219 | Tragic 84.3% |
| Nigerians | 7.2 /100 | #220 | Tragic 84.3% |
| Arabs | 6.8 /100 | #221 | Tragic 84.2% |
| Jordanians | 6.7 /100 | #222 | Tragic 84.2% |
| Scotch-Irish | 6.5 /100 | #223 | Tragic 84.2% |
| Immigrants | West Indies | 6.0 /100 | #224 | Tragic 84.2% |
| Koreans | 5.9 /100 | #225 | Tragic 84.2% |
| Immigrants | Congo | 5.8 /100 | #226 | Tragic 84.2% |
| French American Indians | 5.5 /100 | #227 | Tragic 84.2% |
| Immigrants | Panama | 5.5 /100 | #228 | Tragic 84.2% |
Demographics Similar to Immigrants from Spain by In Labor Force | Age 25-29
In terms of in labor force | age 25-29, the demographic groups most similar to Immigrants from Spain are Immigrants from Burma/Myanmar (84.7%, a difference of 0.0%), Indonesian (84.7%, a difference of 0.0%), Immigrants from Peru (84.7%, a difference of 0.010%), Canadian (84.7%, a difference of 0.010%), and Immigrants from Colombia (84.7%, a difference of 0.010%).
| Demographics | Rating | Rank | In Labor Force | Age 25-29 |
| Immigrants | Western Africa | 60.1 /100 | #159 | Good 84.7% |
| Immigrants | Peru | 58.6 /100 | #160 | Average 84.7% |
| Canadians | 58.5 /100 | #161 | Average 84.7% |
| Immigrants | Colombia | 58.3 /100 | #162 | Average 84.7% |
| Argentineans | 57.9 /100 | #163 | Average 84.7% |
| Ghanaians | 57.6 /100 | #164 | Average 84.7% |
| Immigrants | Burma/Myanmar | 57.4 /100 | #165 | Average 84.7% |
| Immigrants | Spain | 56.9 /100 | #166 | Average 84.7% |
| Indonesians | 56.5 /100 | #167 | Average 84.7% |
| South Americans | 54.9 /100 | #168 | Average 84.7% |
| Celtics | 52.5 /100 | #169 | Average 84.7% |
| Tongans | 52.4 /100 | #170 | Average 84.7% |
| Immigrants | Vietnam | 50.5 /100 | #171 | Average 84.7% |
| Immigrants | Western Europe | 50.4 /100 | #172 | Average 84.7% |
| Assyrians/Chaldeans/Syriacs | 50.2 /100 | #173 | Average 84.7% |