American vs Immigrants from Cambodia In Labor Force | Age 45-54
COMPARE
American
Immigrants from Cambodia
In Labor Force | Age 45-54
In Labor Force | Age 45-54 Comparison
Americans
Immigrants from Cambodia
80.4%
IN LABOR FORCE | AGE 45-54
0.0/ 100
METRIC RATING
297th/ 347
METRIC RANK
81.9%
IN LABOR FORCE | AGE 45-54
0.8/ 100
METRIC RATING
241st/ 347
METRIC RANK
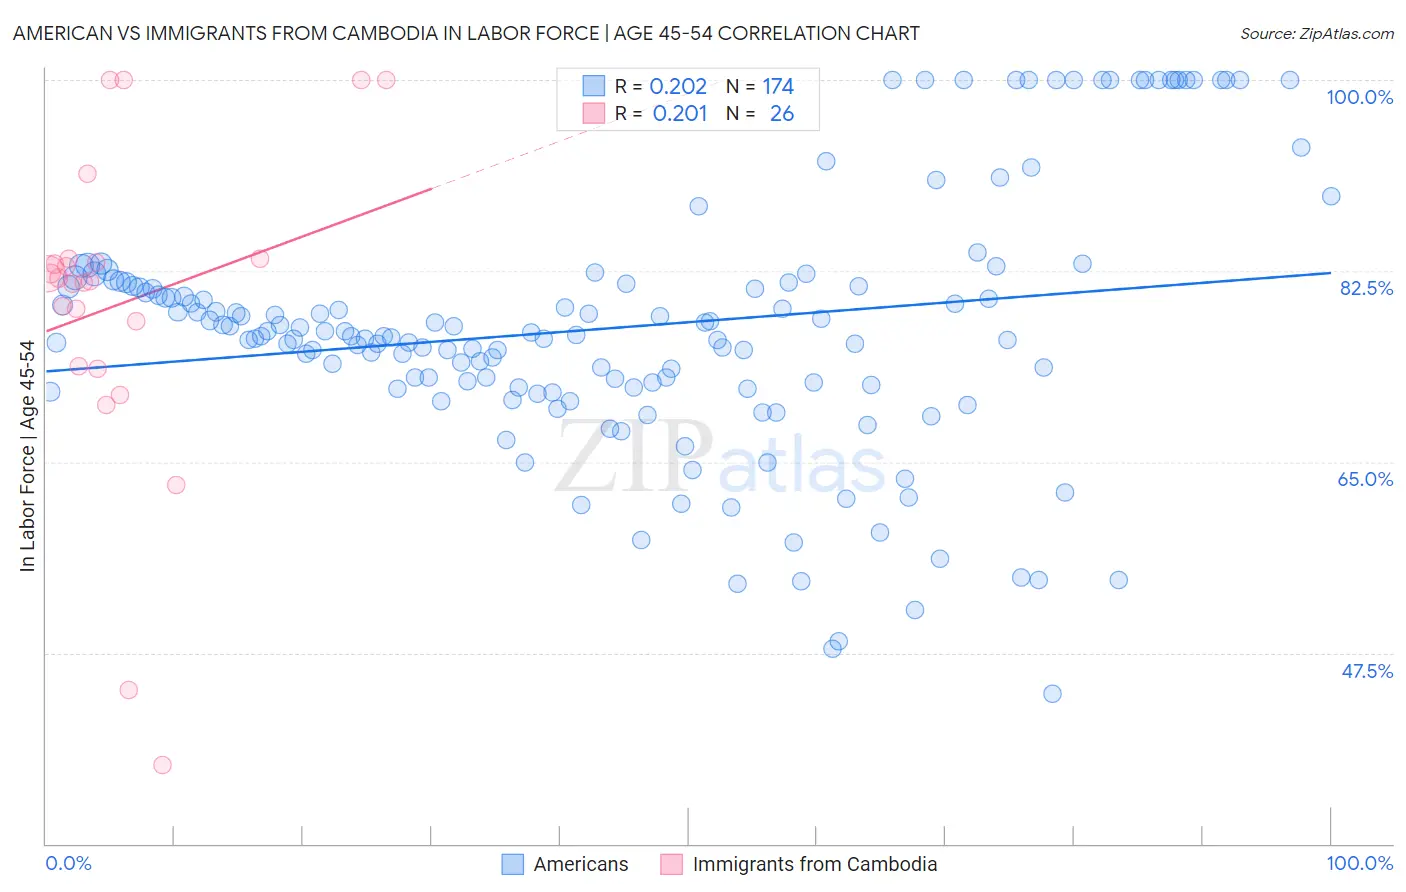
American vs Immigrants from Cambodia In Labor Force | Age 45-54 Correlation Chart
The statistical analysis conducted on geographies consisting of 581,101,031 people shows a weak positive correlation between the proportion of Americans and labor force participation rate among population between the ages 45 and 54 in the United States with a correlation coefficient (R) of 0.202 and weighted average of 80.4%. Similarly, the statistical analysis conducted on geographies consisting of 205,128,905 people shows a weak positive correlation between the proportion of Immigrants from Cambodia and labor force participation rate among population between the ages 45 and 54 in the United States with a correlation coefficient (R) of 0.201 and weighted average of 81.9%, a difference of 1.9%.
In Labor Force | Age 45-54 Correlation Summary
| Measurement | American | Immigrants from Cambodia |
| Minimum | 43.8% | 37.2% |
| Maximum | 100.0% | 100.0% |
| Range | 56.2% | 62.8% |
| Mean | 77.3% | 79.5% |
| Median | 76.6% | 81.7% |
| Interquartile 25% (IQ1) | 71.8% | 73.8% |
| Interquartile 75% (IQ3) | 81.3% | 83.6% |
| Interquartile Range (IQR) | 9.5% | 9.8% |
| Standard Deviation (Sample) | 11.8% | 14.8% |
| Standard Deviation (Population) | 11.8% | 14.5% |
Similar Demographics by In Labor Force | Age 45-54
Demographics Similar to Americans by In Labor Force | Age 45-54
In terms of in labor force | age 45-54, the demographic groups most similar to Americans are Marshallese (80.3%, a difference of 0.040%), Dominican (80.3%, a difference of 0.15%), Fijian (80.2%, a difference of 0.15%), Spanish American Indian (80.2%, a difference of 0.17%), and African (80.5%, a difference of 0.18%).
| Demographics | Rating | Rank | In Labor Force | Age 45-54 |
| Mexican American Indians | 0.0 /100 | #290 | Tragic 80.7% |
| Immigrants | Belize | 0.0 /100 | #291 | Tragic 80.6% |
| Iroquois | 0.0 /100 | #292 | Tragic 80.6% |
| Osage | 0.0 /100 | #293 | Tragic 80.6% |
| Yakama | 0.0 /100 | #294 | Tragic 80.6% |
| Nepalese | 0.0 /100 | #295 | Tragic 80.5% |
| Africans | 0.0 /100 | #296 | Tragic 80.5% |
| Americans | 0.0 /100 | #297 | Tragic 80.4% |
| Marshallese | 0.0 /100 | #298 | Tragic 80.3% |
| Dominicans | 0.0 /100 | #299 | Tragic 80.3% |
| Fijians | 0.0 /100 | #300 | Tragic 80.2% |
| Spanish American Indians | 0.0 /100 | #301 | Tragic 80.2% |
| Immigrants | Central America | 0.0 /100 | #302 | Tragic 80.2% |
| Immigrants | Azores | 0.0 /100 | #303 | Tragic 80.1% |
| Hispanics or Latinos | 0.0 /100 | #304 | Tragic 80.1% |
Demographics Similar to Immigrants from Cambodia by In Labor Force | Age 45-54
In terms of in labor force | age 45-54, the demographic groups most similar to Immigrants from Cambodia are White/Caucasian (81.9%, a difference of 0.040%), Immigrants from El Salvador (81.9%, a difference of 0.050%), Samoan (81.8%, a difference of 0.050%), Immigrants from Thailand (81.9%, a difference of 0.060%), and Trinidadian and Tobagonian (81.9%, a difference of 0.080%).
| Demographics | Rating | Rank | In Labor Force | Age 45-54 |
| Salvadorans | 1.7 /100 | #234 | Tragic 82.0% |
| Sub-Saharan Africans | 1.2 /100 | #235 | Tragic 82.0% |
| Basques | 1.2 /100 | #236 | Tragic 82.0% |
| Immigrants | Trinidad and Tobago | 1.2 /100 | #237 | Tragic 82.0% |
| Trinidadians and Tobagonians | 1.1 /100 | #238 | Tragic 81.9% |
| Immigrants | Thailand | 1.0 /100 | #239 | Tragic 81.9% |
| Immigrants | El Salvador | 1.0 /100 | #240 | Tragic 81.9% |
| Immigrants | Cambodia | 0.8 /100 | #241 | Tragic 81.9% |
| Whites/Caucasians | 0.7 /100 | #242 | Tragic 81.9% |
| Samoans | 0.6 /100 | #243 | Tragic 81.8% |
| Celtics | 0.4 /100 | #244 | Tragic 81.8% |
| Alaska Natives | 0.4 /100 | #245 | Tragic 81.8% |
| Alaskan Athabascans | 0.4 /100 | #246 | Tragic 81.8% |
| Central Americans | 0.4 /100 | #247 | Tragic 81.7% |
| Puget Sound Salish | 0.3 /100 | #248 | Tragic 81.7% |