American vs Arab In Labor Force | Age 45-54
COMPARE
American
Arab
In Labor Force | Age 45-54
In Labor Force | Age 45-54 Comparison
Americans
Arabs
80.4%
IN LABOR FORCE | AGE 45-54
0.0/ 100
METRIC RATING
297th/ 347
METRIC RANK
82.4%
IN LABOR FORCE | AGE 45-54
11.6/ 100
METRIC RATING
203rd/ 347
METRIC RANK
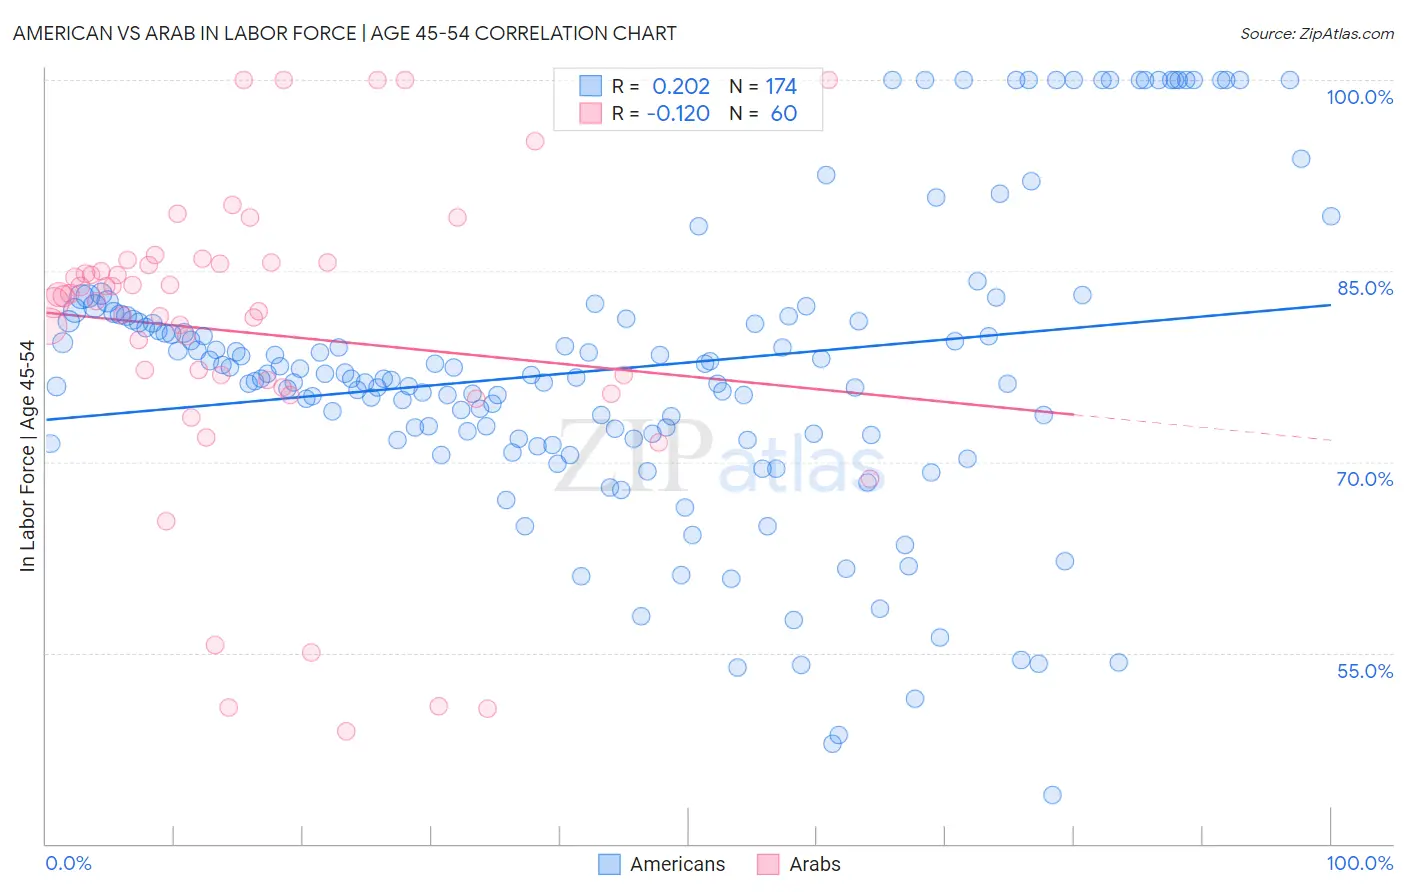
American vs Arab In Labor Force | Age 45-54 Correlation Chart
The statistical analysis conducted on geographies consisting of 581,101,031 people shows a weak positive correlation between the proportion of Americans and labor force participation rate among population between the ages 45 and 54 in the United States with a correlation coefficient (R) of 0.202 and weighted average of 80.4%. Similarly, the statistical analysis conducted on geographies consisting of 486,354,734 people shows a poor negative correlation between the proportion of Arabs and labor force participation rate among population between the ages 45 and 54 in the United States with a correlation coefficient (R) of -0.120 and weighted average of 82.4%, a difference of 2.5%.
In Labor Force | Age 45-54 Correlation Summary
| Measurement | American | Arab |
| Minimum | 43.8% | 48.8% |
| Maximum | 100.0% | 100.0% |
| Range | 56.2% | 51.2% |
| Mean | 77.3% | 80.1% |
| Median | 76.6% | 82.8% |
| Interquartile 25% (IQ1) | 71.8% | 76.1% |
| Interquartile 75% (IQ3) | 81.3% | 85.6% |
| Interquartile Range (IQR) | 9.5% | 9.5% |
| Standard Deviation (Sample) | 11.8% | 12.0% |
| Standard Deviation (Population) | 11.8% | 11.9% |
Similar Demographics by In Labor Force | Age 45-54
Demographics Similar to Americans by In Labor Force | Age 45-54
In terms of in labor force | age 45-54, the demographic groups most similar to Americans are Marshallese (80.3%, a difference of 0.040%), Dominican (80.3%, a difference of 0.15%), Fijian (80.2%, a difference of 0.15%), Spanish American Indian (80.2%, a difference of 0.17%), and African (80.5%, a difference of 0.18%).
| Demographics | Rating | Rank | In Labor Force | Age 45-54 |
| Mexican American Indians | 0.0 /100 | #290 | Tragic 80.7% |
| Immigrants | Belize | 0.0 /100 | #291 | Tragic 80.6% |
| Iroquois | 0.0 /100 | #292 | Tragic 80.6% |
| Osage | 0.0 /100 | #293 | Tragic 80.6% |
| Yakama | 0.0 /100 | #294 | Tragic 80.6% |
| Nepalese | 0.0 /100 | #295 | Tragic 80.5% |
| Africans | 0.0 /100 | #296 | Tragic 80.5% |
| Americans | 0.0 /100 | #297 | Tragic 80.4% |
| Marshallese | 0.0 /100 | #298 | Tragic 80.3% |
| Dominicans | 0.0 /100 | #299 | Tragic 80.3% |
| Fijians | 0.0 /100 | #300 | Tragic 80.2% |
| Spanish American Indians | 0.0 /100 | #301 | Tragic 80.2% |
| Immigrants | Central America | 0.0 /100 | #302 | Tragic 80.2% |
| Immigrants | Azores | 0.0 /100 | #303 | Tragic 80.1% |
| Hispanics or Latinos | 0.0 /100 | #304 | Tragic 80.1% |
Demographics Similar to Arabs by In Labor Force | Age 45-54
In terms of in labor force | age 45-54, the demographic groups most similar to Arabs are Immigrants from Western Europe (82.4%, a difference of 0.010%), Senegalese (82.4%, a difference of 0.050%), Immigrants from Western Asia (82.4%, a difference of 0.060%), Welsh (82.3%, a difference of 0.060%), and French Canadian (82.5%, a difference of 0.070%).
| Demographics | Rating | Rank | In Labor Force | Age 45-54 |
| Immigrants | North America | 18.8 /100 | #196 | Poor 82.5% |
| Lebanese | 18.2 /100 | #197 | Poor 82.5% |
| Immigrants | Denmark | 17.9 /100 | #198 | Poor 82.5% |
| Moroccans | 15.7 /100 | #199 | Poor 82.5% |
| French Canadians | 15.4 /100 | #200 | Poor 82.5% |
| Canadians | 15.1 /100 | #201 | Poor 82.4% |
| Immigrants | Western Asia | 14.9 /100 | #202 | Poor 82.4% |
| Arabs | 11.6 /100 | #203 | Poor 82.4% |
| Immigrants | Western Europe | 10.9 /100 | #204 | Poor 82.4% |
| Senegalese | 9.5 /100 | #205 | Tragic 82.4% |
| Welsh | 9.2 /100 | #206 | Tragic 82.3% |
| Immigrants | Cabo Verde | 8.6 /100 | #207 | Tragic 82.3% |
| Native Hawaiians | 8.5 /100 | #208 | Tragic 82.3% |
| Immigrants | Lebanon | 7.4 /100 | #209 | Tragic 82.3% |
| Immigrants | Bahamas | 7.1 /100 | #210 | Tragic 82.3% |