American vs Ottawa In Labor Force | Age 45-54
COMPARE
American
Ottawa
In Labor Force | Age 45-54
In Labor Force | Age 45-54 Comparison
Americans
Ottawa
80.4%
IN LABOR FORCE | AGE 45-54
0.0/ 100
METRIC RATING
297th/ 347
METRIC RANK
79.5%
IN LABOR FORCE | AGE 45-54
0.0/ 100
METRIC RATING
314th/ 347
METRIC RANK
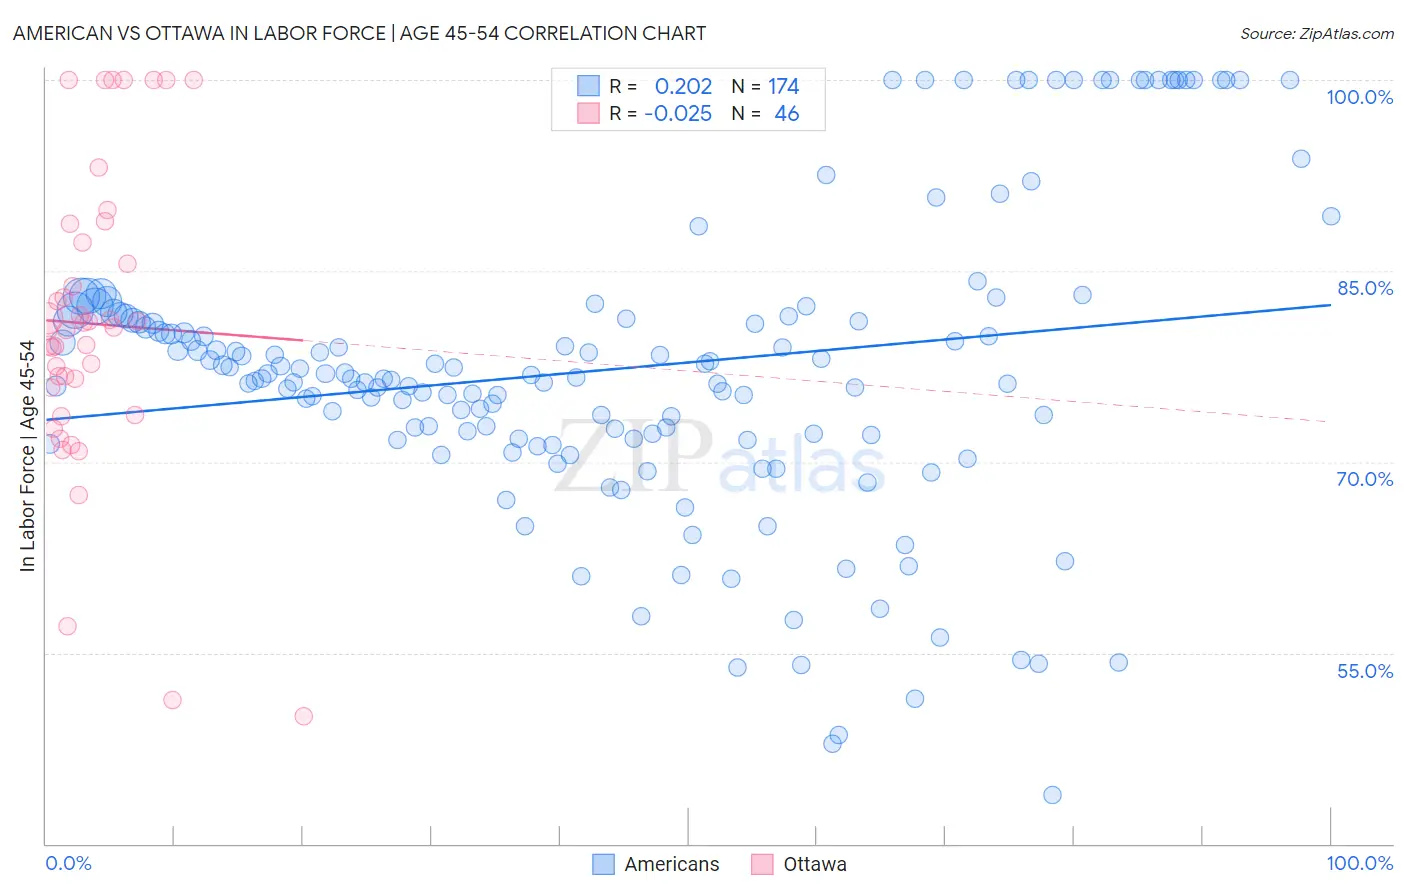
American vs Ottawa In Labor Force | Age 45-54 Correlation Chart
The statistical analysis conducted on geographies consisting of 581,101,031 people shows a weak positive correlation between the proportion of Americans and labor force participation rate among population between the ages 45 and 54 in the United States with a correlation coefficient (R) of 0.202 and weighted average of 80.4%. Similarly, the statistical analysis conducted on geographies consisting of 49,943,956 people shows no correlation between the proportion of Ottawa and labor force participation rate among population between the ages 45 and 54 in the United States with a correlation coefficient (R) of -0.025 and weighted average of 79.5%, a difference of 1.1%.
In Labor Force | Age 45-54 Correlation Summary
| Measurement | American | Ottawa |
| Minimum | 43.8% | 50.0% |
| Maximum | 100.0% | 100.0% |
| Range | 56.2% | 50.0% |
| Mean | 77.3% | 80.8% |
| Median | 76.6% | 80.5% |
| Interquartile 25% (IQ1) | 71.8% | 75.9% |
| Interquartile 75% (IQ3) | 81.3% | 87.2% |
| Interquartile Range (IQR) | 9.5% | 11.4% |
| Standard Deviation (Sample) | 11.8% | 11.8% |
| Standard Deviation (Population) | 11.8% | 11.6% |
Demographics Similar to Americans and Ottawa by In Labor Force | Age 45-54
In terms of in labor force | age 45-54, the demographic groups most similar to Americans are Marshallese (80.3%, a difference of 0.040%), Dominican (80.3%, a difference of 0.15%), Fijian (80.2%, a difference of 0.15%), Spanish American Indian (80.2%, a difference of 0.17%), and African (80.5%, a difference of 0.18%). Similarly, the demographic groups most similar to Ottawa are Colville (79.5%, a difference of 0.040%), Black/African American (79.3%, a difference of 0.14%), Immigrants from Mexico (79.7%, a difference of 0.28%), Mexican (79.8%, a difference of 0.43%), and Inupiat (79.9%, a difference of 0.53%).
| Demographics | Rating | Rank | In Labor Force | Age 45-54 |
| Nepalese | 0.0 /100 | #295 | Tragic 80.5% |
| Africans | 0.0 /100 | #296 | Tragic 80.5% |
| Americans | 0.0 /100 | #297 | Tragic 80.4% |
| Marshallese | 0.0 /100 | #298 | Tragic 80.3% |
| Dominicans | 0.0 /100 | #299 | Tragic 80.3% |
| Fijians | 0.0 /100 | #300 | Tragic 80.2% |
| Spanish American Indians | 0.0 /100 | #301 | Tragic 80.2% |
| Immigrants | Central America | 0.0 /100 | #302 | Tragic 80.2% |
| Immigrants | Azores | 0.0 /100 | #303 | Tragic 80.1% |
| Hispanics or Latinos | 0.0 /100 | #304 | Tragic 80.1% |
| Immigrants | Dominican Republic | 0.0 /100 | #305 | Tragic 80.1% |
| Spanish Americans | 0.0 /100 | #306 | Tragic 80.1% |
| Blackfeet | 0.0 /100 | #307 | Tragic 80.0% |
| Central American Indians | 0.0 /100 | #308 | Tragic 80.0% |
| Potawatomi | 0.0 /100 | #309 | Tragic 80.0% |
| Inupiat | 0.0 /100 | #310 | Tragic 79.9% |
| Mexicans | 0.0 /100 | #311 | Tragic 79.8% |
| Immigrants | Mexico | 0.0 /100 | #312 | Tragic 79.7% |
| Colville | 0.0 /100 | #313 | Tragic 79.5% |
| Ottawa | 0.0 /100 | #314 | Tragic 79.5% |
| Blacks/African Americans | 0.0 /100 | #315 | Tragic 79.3% |