Alsatian vs New Zealander In Labor Force | Age > 16
COMPARE
Alsatian
New Zealander
In Labor Force | Age > 16
In Labor Force | Age > 16 Comparison
Alsatians
New Zealanders
64.7%
IN LABOR FORCE | AGE > 16
10.7/ 100
METRIC RATING
218th/ 347
METRIC RANK
65.7%
IN LABOR FORCE | AGE > 16
96.0/ 100
METRIC RATING
121st/ 347
METRIC RANK
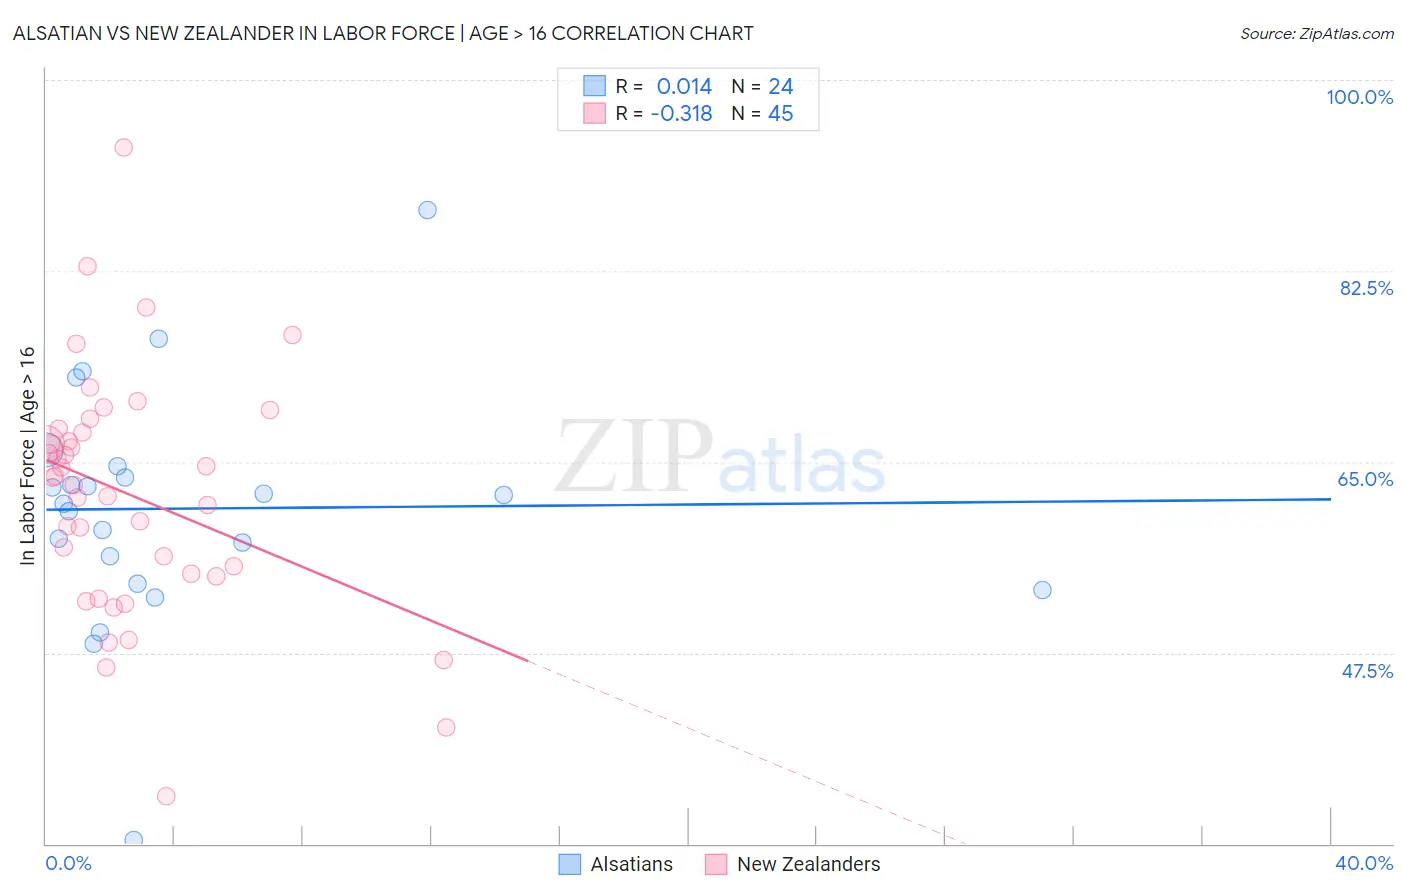
Alsatian vs New Zealander In Labor Force | Age > 16 Correlation Chart
The statistical analysis conducted on geographies consisting of 82,681,658 people shows no correlation between the proportion of Alsatians and labor force participation rate among population ages 16 and over in the United States with a correlation coefficient (R) of 0.014 and weighted average of 64.7%. Similarly, the statistical analysis conducted on geographies consisting of 106,923,900 people shows a mild negative correlation between the proportion of New Zealanders and labor force participation rate among population ages 16 and over in the United States with a correlation coefficient (R) of -0.318 and weighted average of 65.7%, a difference of 1.5%.
In Labor Force | Age > 16 Correlation Summary
| Measurement | Alsatian | New Zealander |
| Minimum | 30.3% | 34.3% |
| Maximum | 88.1% | 93.8% |
| Range | 57.8% | 59.5% |
| Mean | 60.7% | 62.0% |
| Median | 61.6% | 63.6% |
| Interquartile 25% (IQ1) | 55.1% | 54.7% |
| Interquartile 75% (IQ3) | 64.1% | 67.9% |
| Interquartile Range (IQR) | 9.0% | 13.2% |
| Standard Deviation (Sample) | 11.0% | 11.1% |
| Standard Deviation (Population) | 10.8% | 10.9% |
Similar Demographics by In Labor Force | Age > 16
Demographics Similar to Alsatians by In Labor Force | Age > 16
In terms of in labor force | age > 16, the demographic groups most similar to Alsatians are Immigrants from Central America (64.7%, a difference of 0.010%), Belgian (64.7%, a difference of 0.020%), U.S. Virgin Islander (64.7%, a difference of 0.020%), Alaska Native (64.7%, a difference of 0.030%), and Immigrants from Micronesia (64.7%, a difference of 0.030%).
| Demographics | Rating | Rank | In Labor Force | Age > 16 |
| Fijians | 14.1 /100 | #211 | Poor 64.8% |
| Alaskan Athabascans | 13.9 /100 | #212 | Poor 64.8% |
| Maltese | 13.8 /100 | #213 | Poor 64.8% |
| Estonians | 13.1 /100 | #214 | Poor 64.8% |
| Immigrants | Czechoslovakia | 12.3 /100 | #215 | Poor 64.8% |
| Belgians | 11.4 /100 | #216 | Poor 64.7% |
| U.S. Virgin Islanders | 11.3 /100 | #217 | Poor 64.7% |
| Alsatians | 10.7 /100 | #218 | Poor 64.7% |
| Immigrants | Central America | 10.5 /100 | #219 | Poor 64.7% |
| Alaska Natives | 9.9 /100 | #220 | Tragic 64.7% |
| Immigrants | Micronesia | 9.6 /100 | #221 | Tragic 64.7% |
| Hawaiians | 9.3 /100 | #222 | Tragic 64.7% |
| Immigrants | Belize | 9.2 /100 | #223 | Tragic 64.7% |
| Immigrants | Jamaica | 8.8 /100 | #224 | Tragic 64.7% |
| Croatians | 8.8 /100 | #225 | Tragic 64.7% |
Demographics Similar to New Zealanders by In Labor Force | Age > 16
In terms of in labor force | age > 16, the demographic groups most similar to New Zealanders are Immigrants from Ecuador (65.7%, a difference of 0.010%), Immigrants from Hong Kong (65.7%, a difference of 0.020%), Immigrants from France (65.7%, a difference of 0.030%), Immigrants from Iraq (65.7%, a difference of 0.040%), and Iraqi (65.7%, a difference of 0.040%).
| Demographics | Rating | Rank | In Labor Force | Age > 16 |
| Hondurans | 97.1 /100 | #114 | Exceptional 65.8% |
| Immigrants | Indonesia | 96.8 /100 | #115 | Exceptional 65.7% |
| Argentineans | 96.7 /100 | #116 | Exceptional 65.7% |
| Immigrants | Iran | 96.6 /100 | #117 | Exceptional 65.7% |
| Immigrants | Thailand | 96.6 /100 | #118 | Exceptional 65.7% |
| Immigrants | France | 96.4 /100 | #119 | Exceptional 65.7% |
| Immigrants | Hong Kong | 96.2 /100 | #120 | Exceptional 65.7% |
| New Zealanders | 96.0 /100 | #121 | Exceptional 65.7% |
| Immigrants | Ecuador | 95.9 /100 | #122 | Exceptional 65.7% |
| Immigrants | Iraq | 95.5 /100 | #123 | Exceptional 65.7% |
| Iraqis | 95.4 /100 | #124 | Exceptional 65.7% |
| Norwegians | 95.3 /100 | #125 | Exceptional 65.7% |
| Koreans | 95.3 /100 | #126 | Exceptional 65.7% |
| Immigrants | Eastern Asia | 94.9 /100 | #127 | Exceptional 65.7% |
| Ecuadorians | 94.7 /100 | #128 | Exceptional 65.6% |