Aleut vs Potawatomi In Labor Force | Age 35-44
COMPARE
Aleut
Potawatomi
In Labor Force | Age 35-44
In Labor Force | Age 35-44 Comparison
Aleuts
Potawatomi
84.4%
IN LABOR FORCE | AGE 35-44
59.1/ 100
METRIC RATING
163rd/ 347
METRIC RANK
82.7%
IN LABOR FORCE | AGE 35-44
0.0/ 100
METRIC RATING
294th/ 347
METRIC RANK
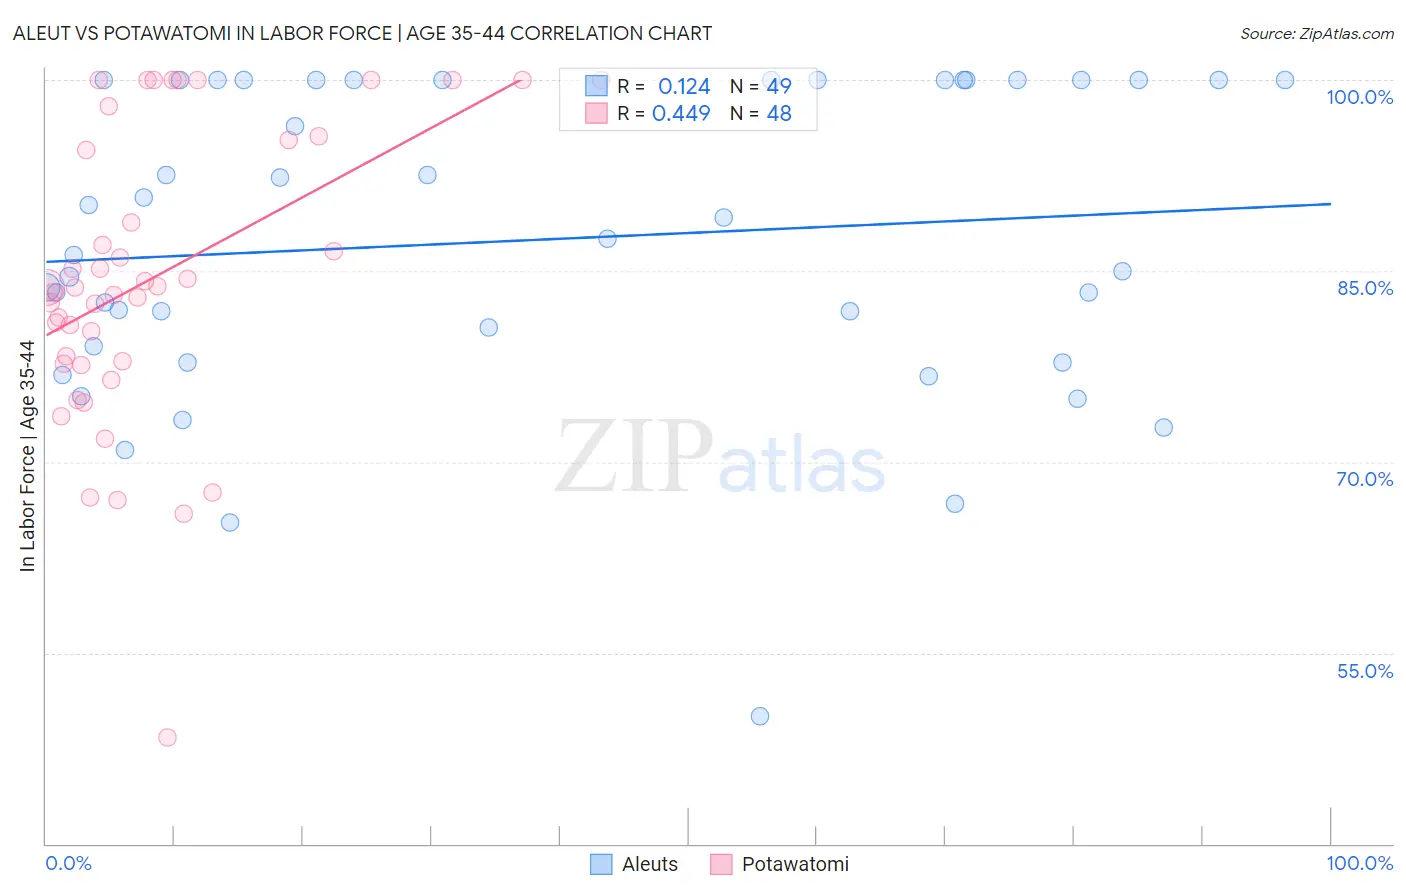
Aleut vs Potawatomi In Labor Force | Age 35-44 Correlation Chart
The statistical analysis conducted on geographies consisting of 61,775,675 people shows a poor positive correlation between the proportion of Aleuts and labor force participation rate among population between the ages 35 and 44 in the United States with a correlation coefficient (R) of 0.124 and weighted average of 84.4%. Similarly, the statistical analysis conducted on geographies consisting of 117,764,721 people shows a moderate positive correlation between the proportion of Potawatomi and labor force participation rate among population between the ages 35 and 44 in the United States with a correlation coefficient (R) of 0.449 and weighted average of 82.7%, a difference of 2.1%.
In Labor Force | Age 35-44 Correlation Summary
| Measurement | Aleut | Potawatomi |
| Minimum | 50.0% | 48.3% |
| Maximum | 100.0% | 100.0% |
| Range | 50.0% | 51.7% |
| Mean | 87.4% | 84.5% |
| Median | 87.5% | 83.7% |
| Interquartile 25% (IQ1) | 78.4% | 77.8% |
| Interquartile 75% (IQ3) | 100.0% | 95.5% |
| Interquartile Range (IQR) | 21.6% | 17.6% |
| Standard Deviation (Sample) | 12.0% | 11.6% |
| Standard Deviation (Population) | 11.9% | 11.4% |
Similar Demographics by In Labor Force | Age 35-44
Demographics Similar to Aleuts by In Labor Force | Age 35-44
In terms of in labor force | age 35-44, the demographic groups most similar to Aleuts are Immigrants from Hungary (84.4%, a difference of 0.0%), Nigerian (84.4%, a difference of 0.0%), Immigrants from Senegal (84.4%, a difference of 0.010%), Immigrants from Kazakhstan (84.4%, a difference of 0.010%), and Immigrants from Venezuela (84.4%, a difference of 0.010%).
| Demographics | Rating | Rank | In Labor Force | Age 35-44 |
| Immigrants | Israel | 64.3 /100 | #156 | Good 84.4% |
| Immigrants | Austria | 63.8 /100 | #157 | Good 84.4% |
| Jamaicans | 62.7 /100 | #158 | Good 84.4% |
| Immigrants | Senegal | 60.4 /100 | #159 | Good 84.4% |
| Immigrants | Kazakhstan | 60.4 /100 | #160 | Good 84.4% |
| Immigrants | Venezuela | 60.0 /100 | #161 | Good 84.4% |
| Immigrants | Hungary | 59.4 /100 | #162 | Average 84.4% |
| Aleuts | 59.1 /100 | #163 | Average 84.4% |
| Nigerians | 58.9 /100 | #164 | Average 84.4% |
| Venezuelans | 58.1 /100 | #165 | Average 84.4% |
| Alsatians | 55.2 /100 | #166 | Average 84.4% |
| Immigrants | Portugal | 55.2 /100 | #167 | Average 84.4% |
| Irish | 53.1 /100 | #168 | Average 84.4% |
| Immigrants | Afghanistan | 52.7 /100 | #169 | Average 84.4% |
| Immigrants | Jordan | 52.5 /100 | #170 | Average 84.4% |
Demographics Similar to Potawatomi by In Labor Force | Age 35-44
In terms of in labor force | age 35-44, the demographic groups most similar to Potawatomi are Immigrants from Lebanon (82.7%, a difference of 0.050%), Spanish American (82.8%, a difference of 0.080%), Mexican American Indian (82.6%, a difference of 0.15%), Hmong (82.6%, a difference of 0.16%), and Immigrants from Latin America (82.8%, a difference of 0.17%).
| Demographics | Rating | Rank | In Labor Force | Age 35-44 |
| Immigrants | Belize | 0.0 /100 | #287 | Tragic 82.9% |
| Puget Sound Salish | 0.0 /100 | #288 | Tragic 82.9% |
| Chippewa | 0.0 /100 | #289 | Tragic 82.9% |
| Africans | 0.0 /100 | #290 | Tragic 82.9% |
| Pennsylvania Germans | 0.0 /100 | #291 | Tragic 82.9% |
| Immigrants | Latin America | 0.0 /100 | #292 | Tragic 82.8% |
| Spanish Americans | 0.0 /100 | #293 | Tragic 82.8% |
| Potawatomi | 0.0 /100 | #294 | Tragic 82.7% |
| Immigrants | Lebanon | 0.0 /100 | #295 | Tragic 82.7% |
| Mexican American Indians | 0.0 /100 | #296 | Tragic 82.6% |
| Hmong | 0.0 /100 | #297 | Tragic 82.6% |
| Ottawa | 0.0 /100 | #298 | Tragic 82.6% |
| Tlingit-Haida | 0.0 /100 | #299 | Tragic 82.5% |
| Central American Indians | 0.0 /100 | #300 | Tragic 82.5% |
| Spanish American Indians | 0.0 /100 | #301 | Tragic 82.5% |