Aleut vs Maltese In Labor Force | Age 35-44
COMPARE
Aleut
Maltese
In Labor Force | Age 35-44
In Labor Force | Age 35-44 Comparison
Aleuts
Maltese
84.4%
IN LABOR FORCE | AGE 35-44
59.1/ 100
METRIC RATING
163rd/ 347
METRIC RANK
84.7%
IN LABOR FORCE | AGE 35-44
90.8/ 100
METRIC RATING
125th/ 347
METRIC RANK
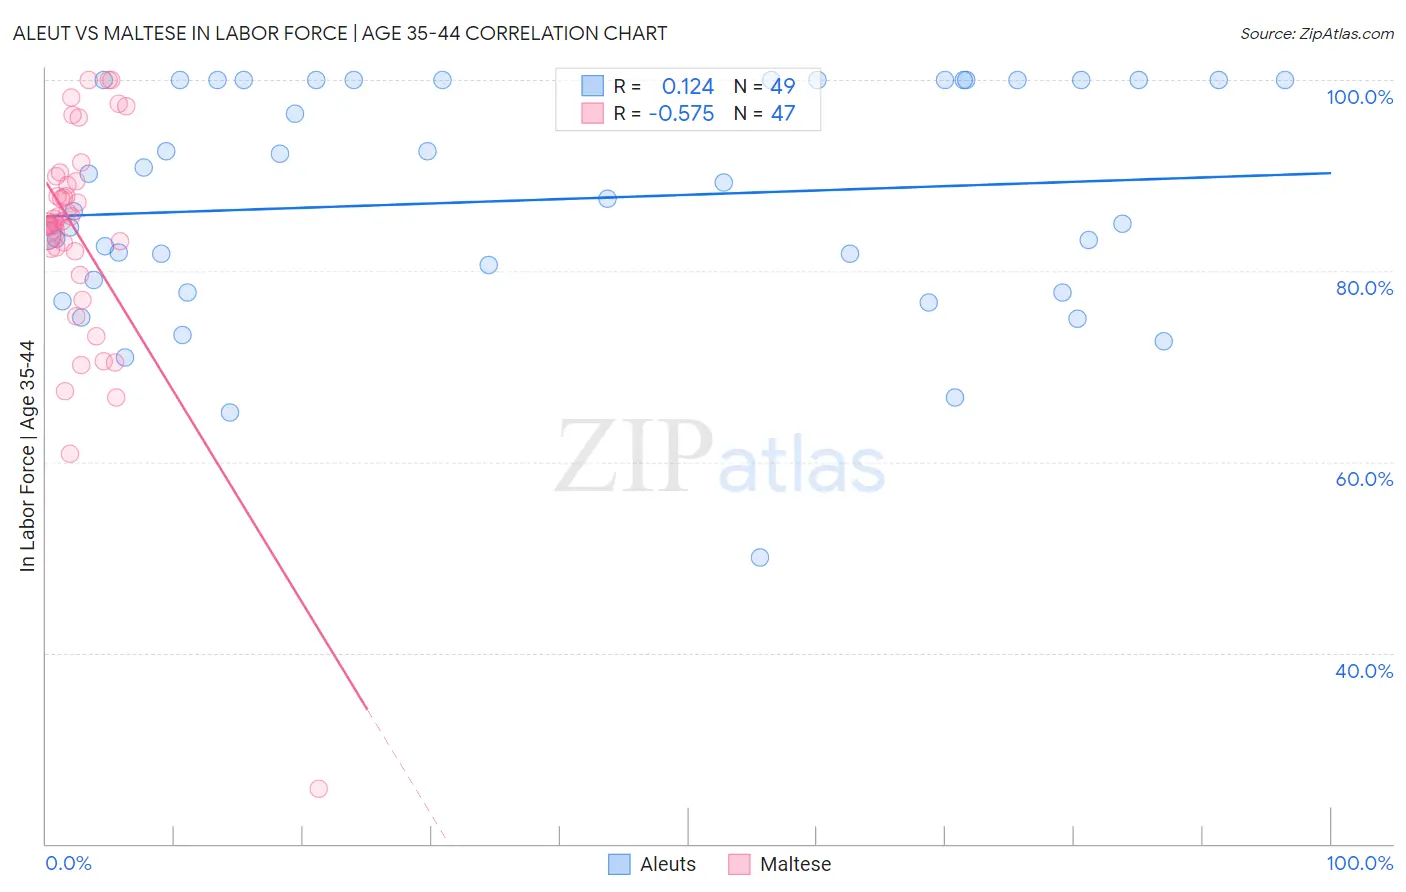
Aleut vs Maltese In Labor Force | Age 35-44 Correlation Chart
The statistical analysis conducted on geographies consisting of 61,775,675 people shows a poor positive correlation between the proportion of Aleuts and labor force participation rate among population between the ages 35 and 44 in the United States with a correlation coefficient (R) of 0.124 and weighted average of 84.4%. Similarly, the statistical analysis conducted on geographies consisting of 126,440,103 people shows a substantial negative correlation between the proportion of Maltese and labor force participation rate among population between the ages 35 and 44 in the United States with a correlation coefficient (R) of -0.575 and weighted average of 84.7%, a difference of 0.31%.
In Labor Force | Age 35-44 Correlation Summary
| Measurement | Aleut | Maltese |
| Minimum | 50.0% | 25.7% |
| Maximum | 100.0% | 100.0% |
| Range | 50.0% | 74.3% |
| Mean | 87.4% | 83.6% |
| Median | 87.5% | 85.1% |
| Interquartile 25% (IQ1) | 78.4% | 82.1% |
| Interquartile 75% (IQ3) | 100.0% | 89.4% |
| Interquartile Range (IQR) | 21.6% | 7.3% |
| Standard Deviation (Sample) | 12.0% | 12.5% |
| Standard Deviation (Population) | 11.9% | 12.4% |
Similar Demographics by In Labor Force | Age 35-44
Demographics Similar to Aleuts by In Labor Force | Age 35-44
In terms of in labor force | age 35-44, the demographic groups most similar to Aleuts are Immigrants from Hungary (84.4%, a difference of 0.0%), Nigerian (84.4%, a difference of 0.0%), Immigrants from Senegal (84.4%, a difference of 0.010%), Immigrants from Kazakhstan (84.4%, a difference of 0.010%), and Immigrants from Venezuela (84.4%, a difference of 0.010%).
| Demographics | Rating | Rank | In Labor Force | Age 35-44 |
| Immigrants | Israel | 64.3 /100 | #156 | Good 84.4% |
| Immigrants | Austria | 63.8 /100 | #157 | Good 84.4% |
| Jamaicans | 62.7 /100 | #158 | Good 84.4% |
| Immigrants | Senegal | 60.4 /100 | #159 | Good 84.4% |
| Immigrants | Kazakhstan | 60.4 /100 | #160 | Good 84.4% |
| Immigrants | Venezuela | 60.0 /100 | #161 | Good 84.4% |
| Immigrants | Hungary | 59.4 /100 | #162 | Average 84.4% |
| Aleuts | 59.1 /100 | #163 | Average 84.4% |
| Nigerians | 58.9 /100 | #164 | Average 84.4% |
| Venezuelans | 58.1 /100 | #165 | Average 84.4% |
| Alsatians | 55.2 /100 | #166 | Average 84.4% |
| Immigrants | Portugal | 55.2 /100 | #167 | Average 84.4% |
| Irish | 53.1 /100 | #168 | Average 84.4% |
| Immigrants | Afghanistan | 52.7 /100 | #169 | Average 84.4% |
| Immigrants | Jordan | 52.5 /100 | #170 | Average 84.4% |
Demographics Similar to Maltese by In Labor Force | Age 35-44
In terms of in labor force | age 35-44, the demographic groups most similar to Maltese are Immigrants from South America (84.7%, a difference of 0.0%), Slavic (84.7%, a difference of 0.0%), Asian (84.7%, a difference of 0.0%), Immigrants from Spain (84.7%, a difference of 0.0%), and Finnish (84.7%, a difference of 0.010%).
| Demographics | Rating | Rank | In Labor Force | Age 35-44 |
| Immigrants | Eastern Asia | 92.1 /100 | #118 | Exceptional 84.7% |
| Burmese | 91.8 /100 | #119 | Exceptional 84.7% |
| Immigrants | Northern Europe | 91.5 /100 | #120 | Exceptional 84.7% |
| Finns | 91.2 /100 | #121 | Exceptional 84.7% |
| Germans | 91.0 /100 | #122 | Exceptional 84.7% |
| Immigrants | South America | 90.9 /100 | #123 | Exceptional 84.7% |
| Slavs | 90.8 /100 | #124 | Exceptional 84.7% |
| Maltese | 90.8 /100 | #125 | Exceptional 84.7% |
| Asians | 90.6 /100 | #126 | Exceptional 84.7% |
| Immigrants | Spain | 90.6 /100 | #127 | Exceptional 84.7% |
| Immigrants | Ghana | 90.4 /100 | #128 | Exceptional 84.7% |
| Palestinians | 89.7 /100 | #129 | Excellent 84.7% |
| Bhutanese | 89.7 /100 | #130 | Excellent 84.7% |
| Immigrants | Scotland | 89.6 /100 | #131 | Excellent 84.7% |
| Austrians | 89.4 /100 | #132 | Excellent 84.7% |