Aleut vs Zimbabwean In Labor Force | Age 16-19
COMPARE
Aleut
Zimbabwean
In Labor Force | Age 16-19
In Labor Force | Age 16-19 Comparison
Aleuts
Zimbabweans
40.4%
IN LABOR FORCE | AGE 16-19
100.0/ 100
METRIC RATING
58th/ 347
METRIC RANK
38.7%
IN LABOR FORCE | AGE 16-19
99.1/ 100
METRIC RATING
102nd/ 347
METRIC RANK
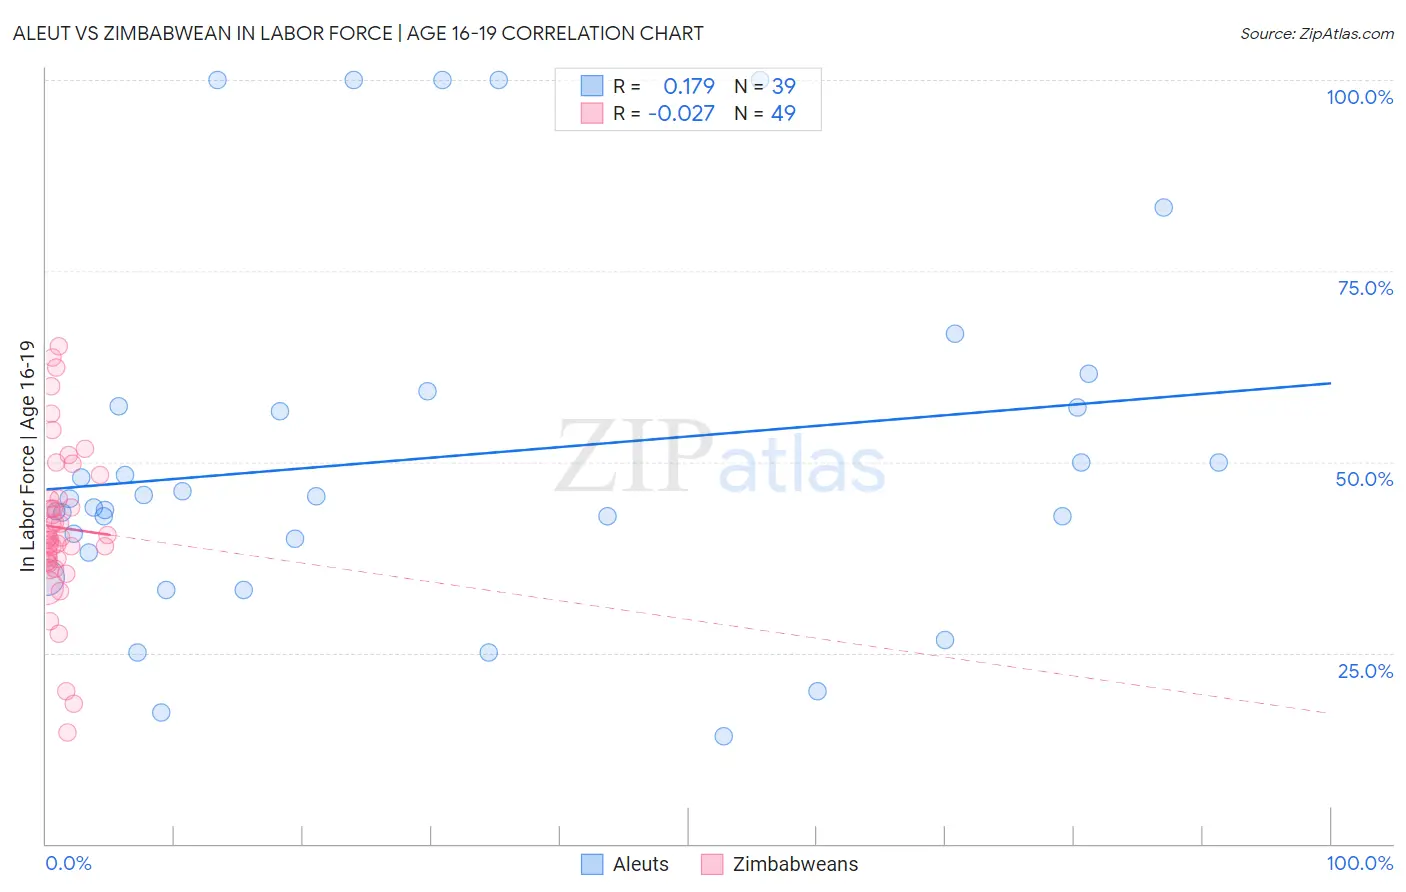
Aleut vs Zimbabwean In Labor Force | Age 16-19 Correlation Chart
The statistical analysis conducted on geographies consisting of 61,744,567 people shows a poor positive correlation between the proportion of Aleuts and labor force participation rate among population between the ages 16 and 19 in the United States with a correlation coefficient (R) of 0.179 and weighted average of 40.4%. Similarly, the statistical analysis conducted on geographies consisting of 69,203,596 people shows no correlation between the proportion of Zimbabweans and labor force participation rate among population between the ages 16 and 19 in the United States with a correlation coefficient (R) of -0.027 and weighted average of 38.7%, a difference of 4.4%.
In Labor Force | Age 16-19 Correlation Summary
| Measurement | Aleut | Zimbabwean |
| Minimum | 14.1% | 14.6% |
| Maximum | 100.0% | 65.2% |
| Range | 85.9% | 50.6% |
| Mean | 50.6% | 41.4% |
| Median | 45.1% | 40.1% |
| Interquartile 25% (IQ1) | 38.2% | 36.9% |
| Interquartile 75% (IQ3) | 57.3% | 45.1% |
| Interquartile Range (IQR) | 19.1% | 8.2% |
| Standard Deviation (Sample) | 23.4% | 10.3% |
| Standard Deviation (Population) | 23.1% | 10.2% |
Similar Demographics by In Labor Force | Age 16-19
Demographics Similar to Aleuts by In Labor Force | Age 16-19
In terms of in labor force | age 16-19, the demographic groups most similar to Aleuts are Lithuanian (40.4%, a difference of 0.010%), Fijian (40.4%, a difference of 0.040%), British (40.5%, a difference of 0.13%), Slavic (40.4%, a difference of 0.13%), and Tlingit-Haida (40.5%, a difference of 0.16%).
| Demographics | Rating | Rank | In Labor Force | Age 16-19 |
| Immigrants | Zaire | 100.0 /100 | #51 | Exceptional 40.7% |
| Immigrants | Laos | 100.0 /100 | #52 | Exceptional 40.6% |
| Immigrants | Kenya | 100.0 /100 | #53 | Exceptional 40.5% |
| Tlingit-Haida | 100.0 /100 | #54 | Exceptional 40.5% |
| British | 100.0 /100 | #55 | Exceptional 40.5% |
| Fijians | 100.0 /100 | #56 | Exceptional 40.4% |
| Lithuanians | 100.0 /100 | #57 | Exceptional 40.4% |
| Aleuts | 100.0 /100 | #58 | Exceptional 40.4% |
| Slavs | 100.0 /100 | #59 | Exceptional 40.4% |
| Immigrants | Eastern Africa | 100.0 /100 | #60 | Exceptional 40.4% |
| Americans | 100.0 /100 | #61 | Exceptional 40.3% |
| Cherokee | 100.0 /100 | #62 | Exceptional 40.2% |
| Northern Europeans | 100.0 /100 | #63 | Exceptional 40.2% |
| Immigrants | Micronesia | 100.0 /100 | #64 | Exceptional 40.2% |
| Kenyans | 100.0 /100 | #65 | Exceptional 40.1% |
Demographics Similar to Zimbabweans by In Labor Force | Age 16-19
In terms of in labor force | age 16-19, the demographic groups most similar to Zimbabweans are Hmong (38.7%, a difference of 0.010%), Immigrants from Cameroon (38.7%, a difference of 0.030%), Immigrants from Thailand (38.7%, a difference of 0.070%), Immigrants from Eritrea (38.7%, a difference of 0.090%), and Iraqi (38.6%, a difference of 0.25%).
| Demographics | Rating | Rank | In Labor Force | Age 16-19 |
| Immigrants | North America | 99.4 /100 | #95 | Exceptional 38.9% |
| Latvians | 99.4 /100 | #96 | Exceptional 38.9% |
| Greeks | 99.3 /100 | #97 | Exceptional 38.9% |
| Ugandans | 99.3 /100 | #98 | Exceptional 38.9% |
| Immigrants | North Macedonia | 99.3 /100 | #99 | Exceptional 38.9% |
| Immigrants | Thailand | 99.1 /100 | #100 | Exceptional 38.7% |
| Hmong | 99.1 /100 | #101 | Exceptional 38.7% |
| Zimbabweans | 99.1 /100 | #102 | Exceptional 38.7% |
| Immigrants | Cameroon | 99.0 /100 | #103 | Exceptional 38.7% |
| Immigrants | Eritrea | 99.0 /100 | #104 | Exceptional 38.7% |
| Iraqis | 98.9 /100 | #105 | Exceptional 38.6% |
| Delaware | 98.8 /100 | #106 | Exceptional 38.6% |
| Chinese | 98.8 /100 | #107 | Exceptional 38.6% |
| Immigrants | Ethiopia | 98.7 /100 | #108 | Exceptional 38.6% |
| Lebanese | 98.7 /100 | #109 | Exceptional 38.6% |