Aleut vs Immigrants from Sierra Leone 8th Grade
COMPARE
Aleut
Immigrants from Sierra Leone
8th Grade
8th Grade Comparison
Aleuts
Immigrants from Sierra Leone
96.9%
8TH GRADE
99.9/ 100
METRIC RATING
43rd/ 347
METRIC RANK
95.1%
8TH GRADE
2.1/ 100
METRIC RATING
239th/ 347
METRIC RANK
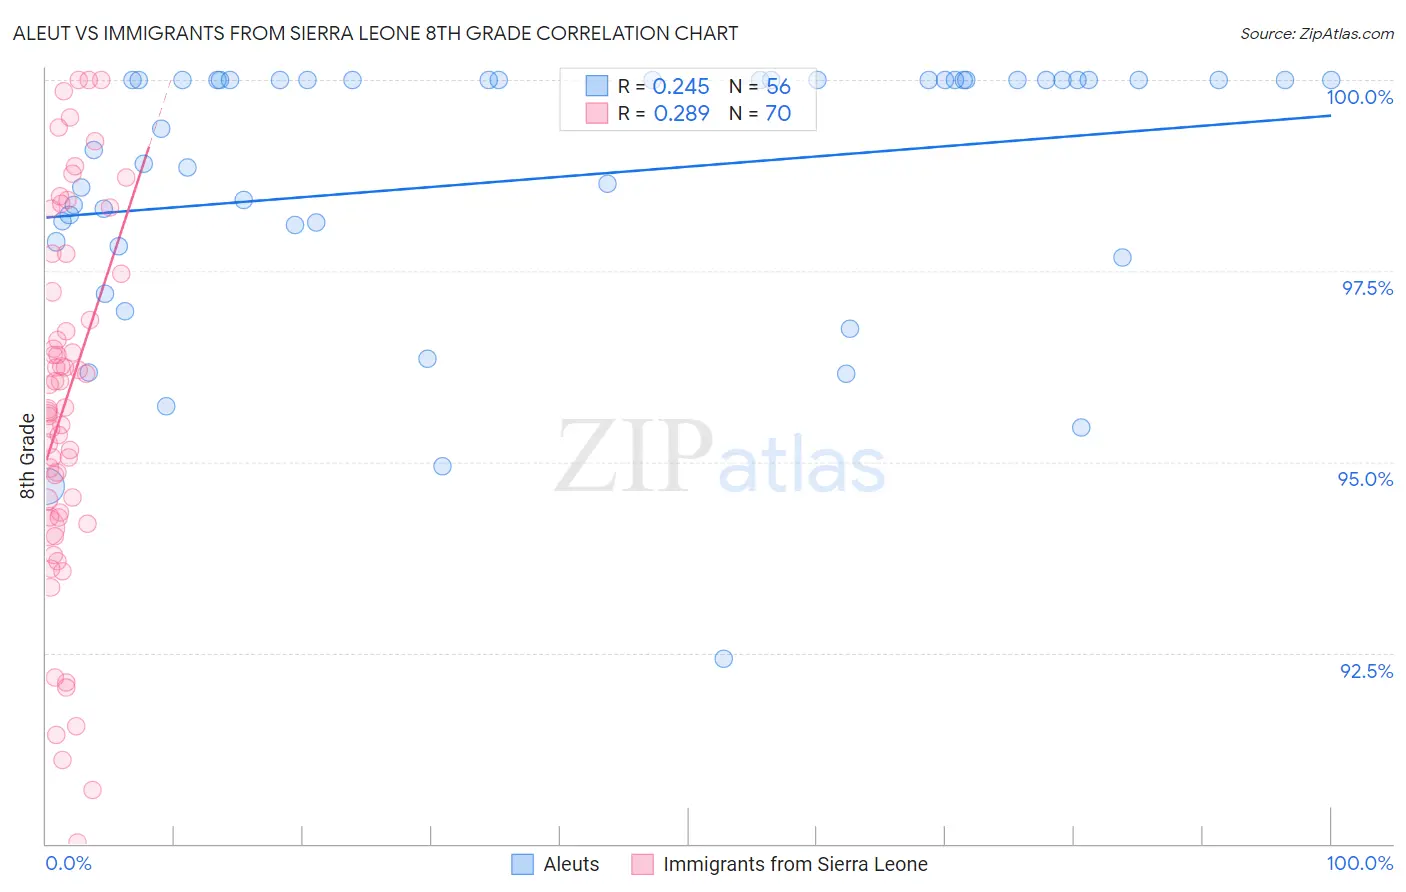
Aleut vs Immigrants from Sierra Leone 8th Grade Correlation Chart
The statistical analysis conducted on geographies consisting of 61,780,964 people shows a weak positive correlation between the proportion of Aleuts and percentage of population with at least 8th grade education in the United States with a correlation coefficient (R) of 0.245 and weighted average of 96.9%. Similarly, the statistical analysis conducted on geographies consisting of 101,634,956 people shows a weak positive correlation between the proportion of Immigrants from Sierra Leone and percentage of population with at least 8th grade education in the United States with a correlation coefficient (R) of 0.289 and weighted average of 95.1%, a difference of 1.8%.
8th Grade Correlation Summary
| Measurement | Aleut | Immigrants from Sierra Leone |
| Minimum | 92.4% | 90.0% |
| Maximum | 100.0% | 100.0% |
| Range | 7.6% | 10.0% |
| Mean | 98.7% | 95.8% |
| Median | 100.0% | 95.7% |
| Interquartile 25% (IQ1) | 98.0% | 94.3% |
| Interquartile 75% (IQ3) | 100.0% | 97.5% |
| Interquartile Range (IQR) | 2.0% | 3.2% |
| Standard Deviation (Sample) | 1.8% | 2.4% |
| Standard Deviation (Population) | 1.7% | 2.4% |
Similar Demographics by 8th Grade
Demographics Similar to Aleuts by 8th Grade
In terms of 8th grade, the demographic groups most similar to Aleuts are Maltese (96.9%, a difference of 0.020%), Northern European (96.9%, a difference of 0.020%), Chinese (96.9%, a difference of 0.030%), Czechoslovakian (96.9%, a difference of 0.030%), and Bulgarian (96.9%, a difference of 0.040%).
| Demographics | Rating | Rank | 8th Grade |
| Belgians | 100.0 /100 | #36 | Exceptional 97.0% |
| Latvians | 100.0 /100 | #37 | Exceptional 97.0% |
| British | 100.0 /100 | #38 | Exceptional 97.0% |
| Hungarians | 100.0 /100 | #39 | Exceptional 97.0% |
| Inupiat | 100.0 /100 | #40 | Exceptional 97.0% |
| Eastern Europeans | 100.0 /100 | #41 | Exceptional 97.0% |
| Chinese | 100.0 /100 | #42 | Exceptional 96.9% |
| Aleuts | 99.9 /100 | #43 | Exceptional 96.9% |
| Maltese | 99.9 /100 | #44 | Exceptional 96.9% |
| Northern Europeans | 99.9 /100 | #45 | Exceptional 96.9% |
| Czechoslovakians | 99.9 /100 | #46 | Exceptional 96.9% |
| Bulgarians | 99.9 /100 | #47 | Exceptional 96.9% |
| Slavs | 99.9 /100 | #48 | Exceptional 96.8% |
| Estonians | 99.9 /100 | #49 | Exceptional 96.8% |
| Immigrants | Scotland | 99.9 /100 | #50 | Exceptional 96.8% |
Demographics Similar to Immigrants from Sierra Leone by 8th Grade
In terms of 8th grade, the demographic groups most similar to Immigrants from Sierra Leone are Ethiopian (95.1%, a difference of 0.0%), South American Indian (95.1%, a difference of 0.010%), Native/Alaskan (95.2%, a difference of 0.020%), Tongan (95.1%, a difference of 0.030%), and Paiute (95.1%, a difference of 0.030%).
| Demographics | Rating | Rank | 8th Grade |
| Indians (Asian) | 3.3 /100 | #232 | Tragic 95.2% |
| Immigrants | Asia | 3.1 /100 | #233 | Tragic 95.2% |
| Costa Ricans | 3.0 /100 | #234 | Tragic 95.2% |
| Nigerians | 2.9 /100 | #235 | Tragic 95.2% |
| Senegalese | 2.7 /100 | #236 | Tragic 95.2% |
| Immigrants | Africa | 2.7 /100 | #237 | Tragic 95.2% |
| Natives/Alaskans | 2.3 /100 | #238 | Tragic 95.2% |
| Immigrants | Sierra Leone | 2.1 /100 | #239 | Tragic 95.1% |
| Ethiopians | 2.0 /100 | #240 | Tragic 95.1% |
| South American Indians | 1.9 /100 | #241 | Tragic 95.1% |
| Tongans | 1.7 /100 | #242 | Tragic 95.1% |
| Paiute | 1.7 /100 | #243 | Tragic 95.1% |
| Immigrants | Middle Africa | 1.7 /100 | #244 | Tragic 95.1% |
| Jamaicans | 1.4 /100 | #245 | Tragic 95.1% |
| Somalis | 1.4 /100 | #246 | Tragic 95.1% |