Comanche vs Belizean In Labor Force | Age > 16

COMPARE

Comanche
Race
Ancestry
AfghanAfricanAlaska NativeAlaskan AthabascanAlbanianAleutAlsatianAmericanApacheArabArapahoArgentineanArmenianAssyrian/Chaldean/SyriacAustralianAustrianBahamianBangladeshiBarbadianBasqueBelgianBermudanBhutaneseBlackfeetBolivianBrazilianBritishBritish West IndianBulgarianBurmeseCajunCambodianCanadianCape VerdeanCarpatho RusynCelticCentral AmericanCentral American IndianCherokeeCheyenneChickasawChileanChineseChippewaChoctawColombianColvilleComancheCosta RicanCreeCreekCroatianCrowCubanCypriotCzechCzechoslovakianDanishDelawareDominicanDutchDutch West IndianEastern EuropeanEcuadorianEgyptianEnglishEstonianEthiopianEuropeanFijianFilipinoFinnishFrenchFrench American IndianFrench CanadianGermanGerman RussianGhanaianGreekGuamanian/ChamorroGuatemalanGuyaneseHaitianHmongHonduranHopiHoumaHungarianIcelanderIndian (Asian)IndonesianInupiatIranianIraqiIrishIroquoisIsraeliItalianJamaicanJapaneseJordanianKenyanKiowaKoreanLaotianLatvianLebaneseLiberianLithuanianLumbeeLuxembourgerMacedonianMalaysianMalteseMarshalleseMenomineeMexicanMexican American IndianMongolianMoroccanNative HawaiianNavajoNepaleseNew ZealanderNicaraguanNigerianNorthern EuropeanNorwegianOkinawanOsageOttawaPaiutePakistaniPalestinianPanamanianParaguayanPennsylvania GermanPeruvianPimaPolishPortuguesePotawatomiPuebloPuerto RicanPuget Sound SalishRomanianRussianSalvadoranSamoanScandinavianScotch-IrishScottishSeminoleSenegaleseSerbianShoshoneSierra LeoneanSiouxSlavicSlovakSloveneSomaliSouth AfricanSouth AmericanSouth American IndianSoviet UnionSpaniardSpanishSpanish AmericanSpanish American IndianSri LankanSubsaharan AfricanSudaneseSwedishSwissSyrianTaiwaneseThaiTlingit-HaidaTohono O'OdhamTonganTrinidadian and TobagonianTsimshianTurkishU.S. Virgin IslanderUgandanUkrainianUruguayanUteVenezuelanVietnameseWelshWest IndianYakamaYaquiYugoslavianYumanYup'ikZimbabwean
Immigration
NonimmigrantsImmigrantsAfghanistanAfricaAlbaniaArgentinaArmeniaAsiaAustraliaAustriaBahamasBangladeshBarbadosBelarusBelgiumBelizeBoliviaBosnia and HerzegovinaBrazilBulgariaBurma/MyanmarCabo VerdeCambodiaCameroonCanadaCaribbeanCentral AmericaChileChinaColombiaCongoCosta RicaCroatiaCubaCzechoslovakiaDenmarkDominicaDominican RepublicEastern AfricaEastern AsiaEastern EuropeEcuadorEgyptEl SalvadorEnglandEritreaEthiopiaEuropeFijiFranceGermanyGhanaGreeceGrenadaGuatemalaGuyanaHaitiHondurasHong KongHungaryIndiaIndonesiaIranIraqIrelandIsraelItalyJamaicaJapanJordanKazakhstanKenyaKoreaKuwaitLaosLatin AmericaLatviaLebanonLiberiaLithuaniaMalaysiaMexicoMicronesiaMiddle AfricaMoldovaMoroccoNepalNetherlandsNicaraguaNigeriaNorth AmericaNorth MacedoniaNorthern AfricaNorthern EuropeNorwayOceaniaPakistanPanamaPeruPhilippinesPolandPortugalRomaniaRussiaSaudi ArabiaScotlandSenegalSerbiaSierra LeoneSingaporeSomaliaSouth AfricaSouth AmericaSouth Central AsiaSouth Eastern AsiaSouthern EuropeSpainSri LankaSt. Vincent and the GrenadinesSudanSwedenSwitzerlandSyriaTaiwanThailandTrinidad and TobagoTurkeyUgandaUkraineUruguayUzbekistanVenezuelaVietnamWest IndiesWestern AfricaWestern AsiaWestern EuropeYemenZaireZimbabweAzores
Belizean
Race
Ancestry
AfghanAfricanAlaska NativeAlaskan AthabascanAlbanianAleutAlsatianAmericanApacheArabArapahoArgentineanArmenianAssyrian/Chaldean/SyriacAustralianAustrianBahamianBangladeshiBarbadianBasqueBelgianBelizeanBermudanBhutaneseBlackfeetBolivianBrazilianBritishBritish West IndianBulgarianBurmeseCajunCambodianCanadianCape VerdeanCarpatho RusynCelticCentral AmericanCentral American IndianCherokeeCheyenneChickasawChileanChineseChippewaChoctawColombianColvilleCosta RicanCreeCreekCroatianCrowCubanCypriotCzechCzechoslovakianDanishDelawareDominicanDutchDutch West IndianEastern EuropeanEcuadorianEgyptianEnglishEstonianEthiopianEuropeanFijianFilipinoFinnishFrenchFrench American IndianFrench CanadianGermanGerman RussianGhanaianGreekGuamanian/ChamorroGuatemalanGuyaneseHaitianHmongHonduranHopiHoumaHungarianIcelanderIndian (Asian)IndonesianInupiatIranianIraqiIrishIroquoisIsraeliItalianJamaicanJapaneseJordanianKenyanKiowaKoreanLaotianLatvianLebaneseLiberianLithuanianLumbeeLuxembourgerMacedonianMalaysianMalteseMarshalleseMenomineeMexicanMexican American IndianMongolianMoroccanNative HawaiianNavajoNepaleseNew ZealanderNicaraguanNigerianNorthern EuropeanNorwegianOkinawanOsageOttawaPaiutePakistaniPalestinianPanamanianParaguayanPennsylvania GermanPeruvianPimaPolishPortuguesePotawatomiPuebloPuerto RicanPuget Sound SalishRomanianRussianSalvadoranSamoanScandinavianScotch-IrishScottishSeminoleSenegaleseSerbianShoshoneSierra LeoneanSiouxSlavicSlovakSloveneSomaliSouth AfricanSouth AmericanSouth American IndianSoviet UnionSpaniardSpanishSpanish AmericanSpanish American IndianSri LankanSubsaharan AfricanSudaneseSwedishSwissSyrianTaiwaneseThaiTlingit-HaidaTohono O'OdhamTonganTrinidadian and TobagonianTsimshianTurkishU.S. Virgin IslanderUgandanUkrainianUruguayanUteVenezuelanVietnameseWelshWest IndianYakamaYaquiYugoslavianYumanYup'ikZimbabwean
Immigration
NonimmigrantsImmigrantsAfghanistanAfricaAlbaniaArgentinaArmeniaAsiaAustraliaAustriaBahamasBangladeshBarbadosBelarusBelgiumBelizeBoliviaBosnia and HerzegovinaBrazilBulgariaBurma/MyanmarCabo VerdeCambodiaCameroonCanadaCaribbeanCentral AmericaChileChinaColombiaCongoCosta RicaCroatiaCubaCzechoslovakiaDenmarkDominicaDominican RepublicEastern AfricaEastern AsiaEastern EuropeEcuadorEgyptEl SalvadorEnglandEritreaEthiopiaEuropeFijiFranceGermanyGhanaGreeceGrenadaGuatemalaGuyanaHaitiHondurasHong KongHungaryIndiaIndonesiaIranIraqIrelandIsraelItalyJamaicaJapanJordanKazakhstanKenyaKoreaKuwaitLaosLatin AmericaLatviaLebanonLiberiaLithuaniaMalaysiaMexicoMicronesiaMiddle AfricaMoldovaMoroccoNepalNetherlandsNicaraguaNigeriaNorth AmericaNorth MacedoniaNorthern AfricaNorthern EuropeNorwayOceaniaPakistanPanamaPeruPhilippinesPolandPortugalRomaniaRussiaSaudi ArabiaScotlandSenegalSerbiaSierra LeoneSingaporeSomaliaSouth AfricaSouth AmericaSouth Central AsiaSouth Eastern AsiaSouthern EuropeSpainSri LankaSt. Vincent and the GrenadinesSudanSwedenSwitzerlandSyriaTaiwanThailandTrinidad and TobagoTurkeyUgandaUkraineUruguayUzbekistanVenezuelaVietnamWest IndiesWestern AfricaWestern AsiaWestern EuropeYemenZaireZimbabweAzores
In Labor Force | Age > 16
Income
Poverty
Unemployment
Labor Participation
Family Structure
Vehicle Availability
Education Level
Disability

In Labor Force | Age > 16 Comparison

Comanche

Belizeans

Tragic
Poor
63.6%
IN LABOR FORCE | AGE > 16
0.0/ 100
METRIC RATING
298th/ 347
METRIC RANK
64.8%
IN LABOR FORCE | AGE > 16
16.2/ 100
METRIC RATING
208th/ 347
METRIC RANK

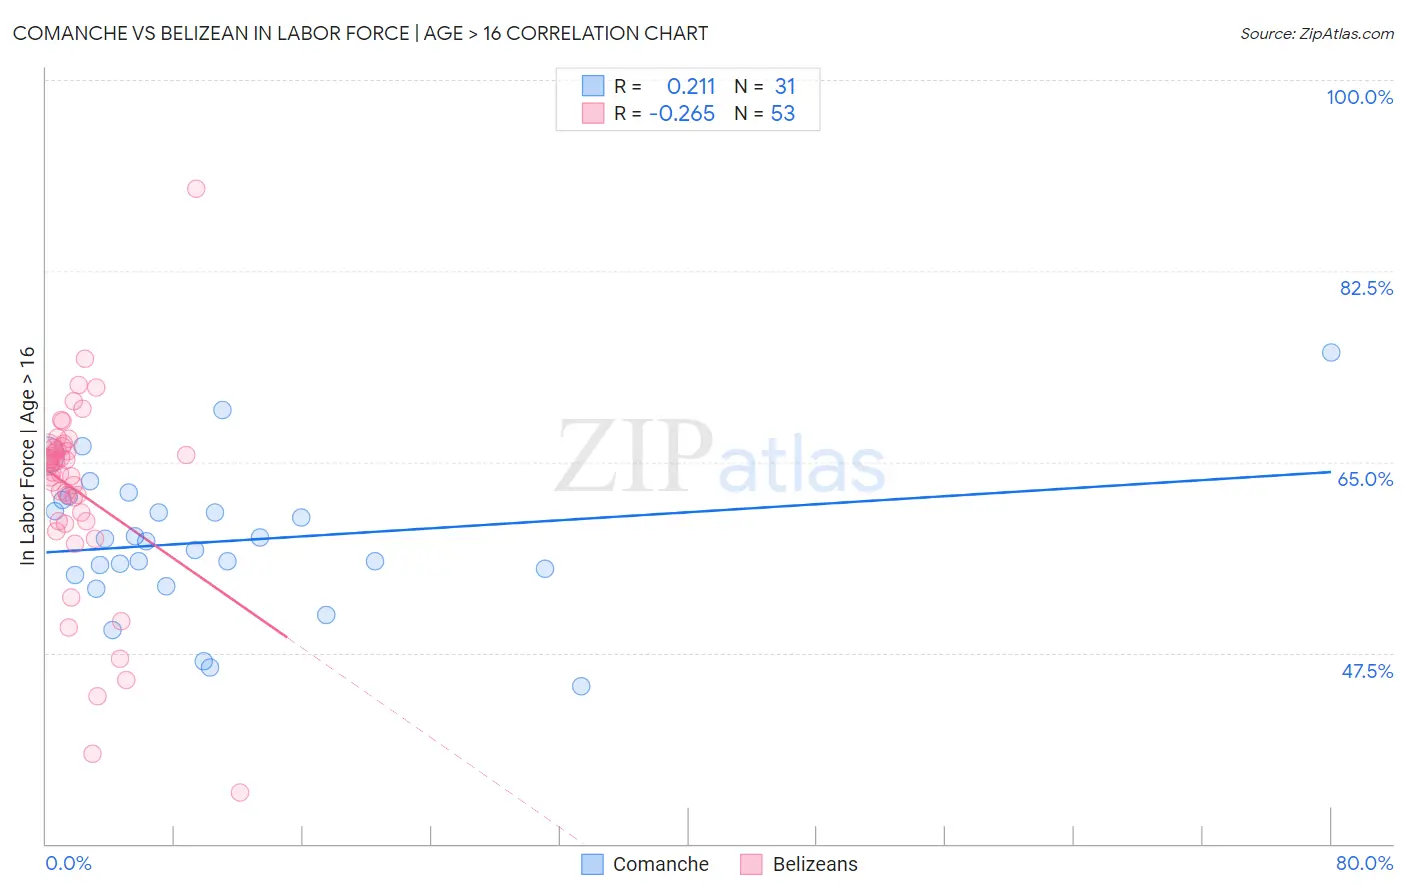
Comanche vs Belizean In Labor Force | Age > 16 Correlation Chart

The statistical analysis conducted on geographies consisting of 109,783,732 people shows a weak positive correlation between the proportion of Comanche and labor force participation rate among population ages 16 and over in the United States with a correlation coefficient (R) of 0.211 and weighted average of 63.6%. Similarly, the statistical analysis conducted on geographies consisting of 144,214,233 people shows a weak negative correlation between the proportion of Belizeans and labor force participation rate among population ages 16 and over in the United States with a correlation coefficient (R) of -0.265 and weighted average of 64.8%, a difference of 1.9%.
Comanche vs Belizean In Labor Force | Age > 16

In Labor Force | Age > 16 Correlation Summary

MeasurementComancheBelizean
Minimum44.4%34.7%
Maximum75.0%90.0%
Range30.6%55.3%
Mean57.7%62.3%
Median57.7%64.7%
Interquartile 25% (IQ1)54.7%59.6%
Interquartile 75% (IQ3)61.5%66.2%
Interquartile Range (IQR)6.9%6.6%
Standard Deviation (Sample)6.6%9.1%
Standard Deviation (Population)6.5%9.0%

Similar Demographics by In Labor Force | Age > 16

Demographics Similar to Comanche by In Labor Force | Age > 16

In terms of in labor force | age > 16, the demographic groups most similar to Comanche are Immigrants from Grenada (63.6%, a difference of 0.010%), White/Caucasian (63.6%, a difference of 0.060%), Immigrants from the Azores (63.6%, a difference of 0.060%), Immigrants from North America (63.7%, a difference of 0.090%), and Spanish American (63.6%, a difference of 0.090%).
DemographicsRating | RankIn Labor Force | Age > 16
Nepalese
0.1
/100
|
#291
Tragic
63.8%
Spanish American Indians
0.1
/100
|
#292
Tragic
63.8%
English
0.1
/100
|
#293
Tragic
63.7%
Puget Sound Salish
0.0
/100
|
#294
Tragic
63.7%
Immigrants | Canada
0.0
/100
|
#295
Tragic
63.7%
Immigrants | North America
0.0
/100
|
#296
Tragic
63.7%
Immigrants | Grenada
0.0
/100
|
#297
Tragic
63.6%
Comanche
0.0
/100
|
#298
Tragic
63.6%
Whites/Caucasians
0.0
/100
|
#299
Tragic
63.6%
Immigrants | Azores
0.0
/100
|
#300
Tragic
63.6%
Spanish Americans
0.0
/100
|
#301
Tragic
63.6%
Delaware
0.0
/100
|
#302
Tragic
63.6%
Cree
0.0
/100
|
#303
Tragic
63.5%
Immigrants | Nonimmigrants
0.0
/100
|
#304
Tragic
63.5%
Osage
0.0
/100
|
#305
Tragic
63.5%

Demographics Similar to Belizeans by In Labor Force | Age > 16

In terms of in labor force | age > 16, the demographic groups most similar to Belizeans are Immigrants from Latin America (64.8%, a difference of 0.010%), Immigrants from Trinidad and Tobago (64.8%, a difference of 0.010%), Lithuanian (64.8%, a difference of 0.020%), Immigrants from Denmark (64.8%, a difference of 0.030%), and Fijian (64.8%, a difference of 0.040%).
DemographicsRating | RankIn Labor Force | Age > 16
Ukrainians
19.6
/100
|
#201
Poor
64.9%
Immigrants | Belgium
19.4
/100
|
#202
Poor
64.9%
Russians
18.8
/100
|
#203
Poor
64.9%
Slovenes
18.7
/100
|
#204
Poor
64.9%
Jamaicans
18.7
/100
|
#205
Poor
64.9%
Lithuanians
17.4
/100
|
#206
Poor
64.8%
Immigrants | Latin America
16.4
/100
|
#207
Poor
64.8%
Belizeans
16.2
/100
|
#208
Poor
64.8%
Immigrants | Trinidad and Tobago
15.6
/100
|
#209
Poor
64.8%
Immigrants | Denmark
14.7
/100
|
#210
Poor
64.8%
Fijians
14.1
/100
|
#211
Poor
64.8%
Alaskan Athabascans
13.9
/100
|
#212
Poor
64.8%
Maltese
13.8
/100
|
#213
Poor
64.8%
Estonians
13.1
/100
|
#214
Poor
64.8%
Immigrants | Czechoslovakia
12.3
/100
|
#215
Poor
64.8%