Alaskan Athabascan vs Norwegian In Labor Force | Age 30-34
COMPARE
Alaskan Athabascan
Norwegian
In Labor Force | Age 30-34
In Labor Force | Age 30-34 Comparison
Alaskan Athabascans
Norwegians
81.7%
IN LABOR FORCE | AGE 30-34
0.0/ 100
METRIC RATING
314th/ 347
METRIC RANK
85.7%
IN LABOR FORCE | AGE 30-34
99.9/ 100
METRIC RATING
37th/ 347
METRIC RANK
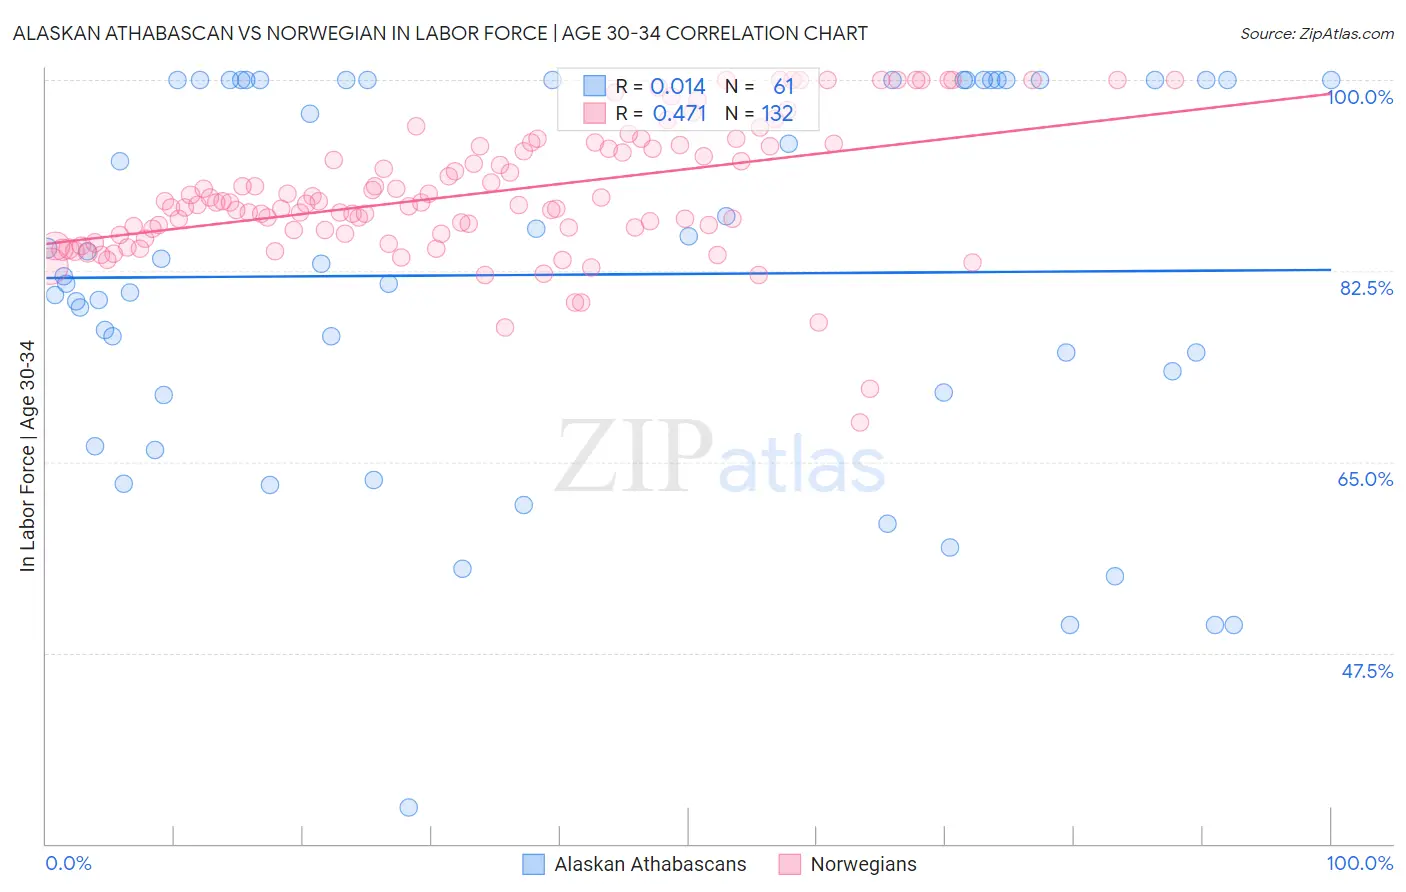
Alaskan Athabascan vs Norwegian In Labor Force | Age 30-34 Correlation Chart
The statistical analysis conducted on geographies consisting of 45,811,893 people shows no correlation between the proportion of Alaskan Athabascans and labor force participation rate among population between the ages 30 and 34 in the United States with a correlation coefficient (R) of 0.014 and weighted average of 81.7%. Similarly, the statistical analysis conducted on geographies consisting of 532,518,250 people shows a moderate positive correlation between the proportion of Norwegians and labor force participation rate among population between the ages 30 and 34 in the United States with a correlation coefficient (R) of 0.471 and weighted average of 85.7%, a difference of 5.0%.
In Labor Force | Age 30-34 Correlation Summary
| Measurement | Alaskan Athabascan | Norwegian |
| Minimum | 33.3% | 68.6% |
| Maximum | 100.0% | 100.0% |
| Range | 66.7% | 31.4% |
| Mean | 82.2% | 89.6% |
| Median | 83.2% | 88.7% |
| Interquartile 25% (IQ1) | 71.3% | 85.9% |
| Interquartile 75% (IQ3) | 100.0% | 94.0% |
| Interquartile Range (IQR) | 28.7% | 8.0% |
| Standard Deviation (Sample) | 17.3% | 6.0% |
| Standard Deviation (Population) | 17.2% | 6.0% |
Similar Demographics by In Labor Force | Age 30-34
Demographics Similar to Alaskan Athabascans by In Labor Force | Age 30-34
In terms of in labor force | age 30-34, the demographic groups most similar to Alaskan Athabascans are Cherokee (81.6%, a difference of 0.10%), Iroquois (81.9%, a difference of 0.25%), Immigrants from the Azores (81.5%, a difference of 0.25%), Arapaho (81.5%, a difference of 0.26%), and Chickasaw (81.9%, a difference of 0.27%).
| Demographics | Rating | Rank | In Labor Force | Age 30-34 |
| Menominee | 0.0 /100 | #307 | Tragic 82.2% |
| Puget Sound Salish | 0.0 /100 | #308 | Tragic 82.1% |
| Immigrants | Mexico | 0.0 /100 | #309 | Tragic 82.0% |
| Cajuns | 0.0 /100 | #310 | Tragic 82.0% |
| Chickasaw | 0.0 /100 | #311 | Tragic 81.9% |
| Mexicans | 0.0 /100 | #312 | Tragic 81.9% |
| Iroquois | 0.0 /100 | #313 | Tragic 81.9% |
| Alaskan Athabascans | 0.0 /100 | #314 | Tragic 81.7% |
| Cherokee | 0.0 /100 | #315 | Tragic 81.6% |
| Immigrants | Azores | 0.0 /100 | #316 | Tragic 81.5% |
| Arapaho | 0.0 /100 | #317 | Tragic 81.5% |
| Choctaw | 0.0 /100 | #318 | Tragic 81.4% |
| Shoshone | 0.0 /100 | #319 | Tragic 81.4% |
| Yaqui | 0.0 /100 | #320 | Tragic 81.4% |
| Alaska Natives | 0.0 /100 | #321 | Tragic 81.3% |
Demographics Similar to Norwegians by In Labor Force | Age 30-34
In terms of in labor force | age 30-34, the demographic groups most similar to Norwegians are Serbian (85.8%, a difference of 0.010%), Albanian (85.7%, a difference of 0.010%), Immigrants from Greece (85.7%, a difference of 0.010%), Immigrants from Bosnia and Herzegovina (85.8%, a difference of 0.020%), and Ugandan (85.8%, a difference of 0.020%).
| Demographics | Rating | Rank | In Labor Force | Age 30-34 |
| Immigrants | Hong Kong | 100.0 /100 | #30 | Exceptional 85.8% |
| Paraguayans | 99.9 /100 | #31 | Exceptional 85.8% |
| Cypriots | 99.9 /100 | #32 | Exceptional 85.8% |
| Immigrants | Bosnia and Herzegovina | 99.9 /100 | #33 | Exceptional 85.8% |
| Ugandans | 99.9 /100 | #34 | Exceptional 85.8% |
| Serbians | 99.9 /100 | #35 | Exceptional 85.8% |
| Albanians | 99.9 /100 | #36 | Exceptional 85.7% |
| Norwegians | 99.9 /100 | #37 | Exceptional 85.7% |
| Immigrants | Greece | 99.9 /100 | #38 | Exceptional 85.7% |
| Eastern Europeans | 99.9 /100 | #39 | Exceptional 85.7% |
| Turks | 99.9 /100 | #40 | Exceptional 85.7% |
| Immigrants | Italy | 99.9 /100 | #41 | Exceptional 85.7% |
| Zimbabweans | 99.8 /100 | #42 | Exceptional 85.6% |
| Immigrants | Lithuania | 99.8 /100 | #43 | Exceptional 85.6% |
| Immigrants | Sri Lanka | 99.8 /100 | #44 | Exceptional 85.6% |