Alaskan Athabascan vs Norwegian Unemployment Among Ages 55 to 59 years
COMPARE
Alaskan Athabascan
Norwegian
Unemployment Among Ages 55 to 59 years
Unemployment Among Ages 55 to 59 years Comparison
Alaskan Athabascans
Norwegians
7.1%
UNEMPLOYMENT AMONG AGES 55 TO 59 YEARS
0.0/ 100
METRIC RATING
340th/ 347
METRIC RANK
4.2%
UNEMPLOYMENT AMONG AGES 55 TO 59 YEARS
100.0/ 100
METRIC RATING
6th/ 347
METRIC RANK
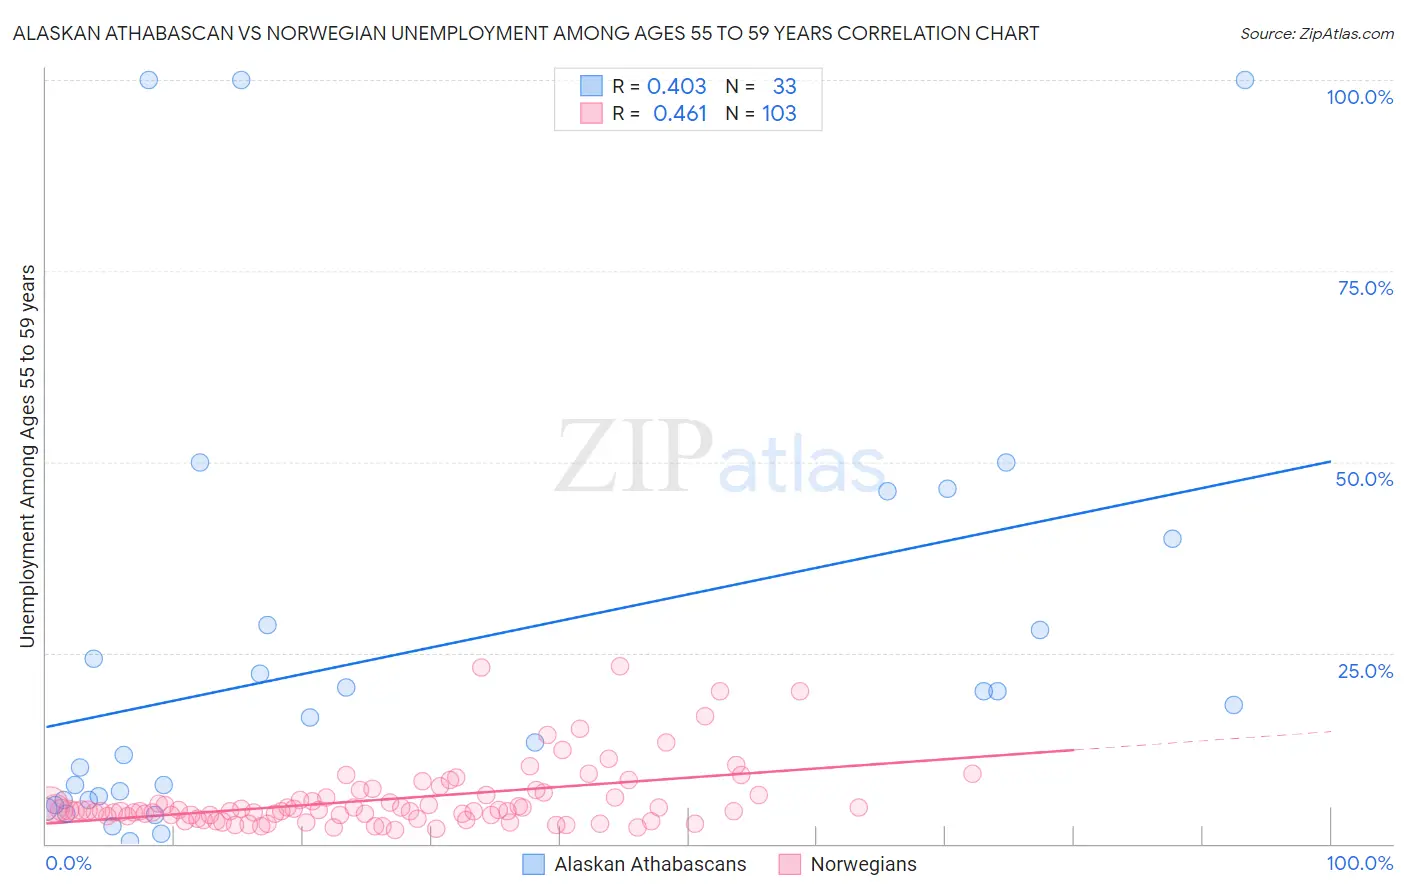
Alaskan Athabascan vs Norwegian Unemployment Among Ages 55 to 59 years Correlation Chart
The statistical analysis conducted on geographies consisting of 44,601,853 people shows a moderate positive correlation between the proportion of Alaskan Athabascans and unemployment rate among population between the ages 55 and 59 in the United States with a correlation coefficient (R) of 0.403 and weighted average of 7.1%. Similarly, the statistical analysis conducted on geographies consisting of 463,929,347 people shows a moderate positive correlation between the proportion of Norwegians and unemployment rate among population between the ages 55 and 59 in the United States with a correlation coefficient (R) of 0.461 and weighted average of 4.2%, a difference of 69.6%.
Unemployment Among Ages 55 to 59 years Correlation Summary
| Measurement | Alaskan Athabascan | Norwegian |
| Minimum | 0.40% | 1.8% |
| Maximum | 100.0% | 23.3% |
| Range | 99.6% | 21.5% |
| Mean | 25.1% | 5.8% |
| Median | 16.5% | 4.4% |
| Interquartile 25% (IQ1) | 5.7% | 3.6% |
| Interquartile 75% (IQ3) | 34.3% | 6.4% |
| Interquartile Range (IQR) | 28.6% | 2.7% |
| Standard Deviation (Sample) | 28.2% | 4.3% |
| Standard Deviation (Population) | 27.8% | 4.3% |
Similar Demographics by Unemployment Among Ages 55 to 59 years
Demographics Similar to Alaskan Athabascans by Unemployment Among Ages 55 to 59 years
In terms of unemployment among ages 55 to 59 years, the demographic groups most similar to Alaskan Athabascans are Puerto Rican (7.0%, a difference of 2.5%), Shoshone (7.4%, a difference of 3.3%), Immigrants from Yemen (6.9%, a difference of 3.6%), Paiute (6.8%, a difference of 5.6%), and Navajo (6.7%, a difference of 6.1%).
| Demographics | Rating | Rank | Unemployment Among Ages 55 to 59 years |
| Pima | 0.0 /100 | #333 | Tragic 6.6% |
| Pueblo | 0.0 /100 | #334 | Tragic 6.7% |
| Colville | 0.0 /100 | #335 | Tragic 6.7% |
| Navajo | 0.0 /100 | #336 | Tragic 6.7% |
| Paiute | 0.0 /100 | #337 | Tragic 6.8% |
| Immigrants | Yemen | 0.0 /100 | #338 | Tragic 6.9% |
| Puerto Ricans | 0.0 /100 | #339 | Tragic 7.0% |
| Alaskan Athabascans | 0.0 /100 | #340 | Tragic 7.1% |
| Shoshone | 0.0 /100 | #341 | Tragic 7.4% |
| Hopi | 0.0 /100 | #342 | Tragic 8.1% |
| Yakama | 0.0 /100 | #343 | Tragic 8.9% |
| Inupiat | 0.0 /100 | #344 | Tragic 9.0% |
| Tohono O'odham | 0.0 /100 | #345 | Tragic 9.3% |
| Menominee | 0.0 /100 | #346 | Tragic 10.5% |
| Yup'ik | 0.0 /100 | #347 | Tragic 13.9% |
Demographics Similar to Norwegians by Unemployment Among Ages 55 to 59 years
In terms of unemployment among ages 55 to 59 years, the demographic groups most similar to Norwegians are Zimbabwean (4.2%, a difference of 0.57%), Immigrants from Bolivia (4.2%, a difference of 0.58%), Bolivian (4.2%, a difference of 0.68%), Cuban (4.2%, a difference of 0.80%), and Venezuelan (4.2%, a difference of 1.1%).
| Demographics | Rating | Rank | Unemployment Among Ages 55 to 59 years |
| Fijians | 100.0 /100 | #1 | Exceptional 4.1% |
| Immigrants | Cuba | 100.0 /100 | #2 | Exceptional 4.1% |
| Immigrants | Venezuela | 100.0 /100 | #3 | Exceptional 4.1% |
| Venezuelans | 100.0 /100 | #4 | Exceptional 4.2% |
| Immigrants | Bolivia | 100.0 /100 | #5 | Exceptional 4.2% |
| Norwegians | 100.0 /100 | #6 | Exceptional 4.2% |
| Zimbabweans | 100.0 /100 | #7 | Exceptional 4.2% |
| Bolivians | 100.0 /100 | #8 | Exceptional 4.2% |
| Cubans | 100.0 /100 | #9 | Exceptional 4.2% |
| Tongans | 100.0 /100 | #10 | Exceptional 4.3% |
| Immigrants | Congo | 100.0 /100 | #11 | Exceptional 4.3% |
| Danes | 100.0 /100 | #12 | Exceptional 4.3% |
| Indonesians | 100.0 /100 | #13 | Exceptional 4.3% |
| Immigrants | India | 100.0 /100 | #14 | Exceptional 4.3% |
| Bulgarians | 100.0 /100 | #15 | Exceptional 4.3% |