Alaskan Athabascan vs Polish In Labor Force | Age 30-34
COMPARE
Alaskan Athabascan
Polish
In Labor Force | Age 30-34
In Labor Force | Age 30-34 Comparison
Alaskan Athabascans
Poles
81.7%
IN LABOR FORCE | AGE 30-34
0.0/ 100
METRIC RATING
314th/ 347
METRIC RANK
85.5%
IN LABOR FORCE | AGE 30-34
99.6/ 100
METRIC RATING
58th/ 347
METRIC RANK
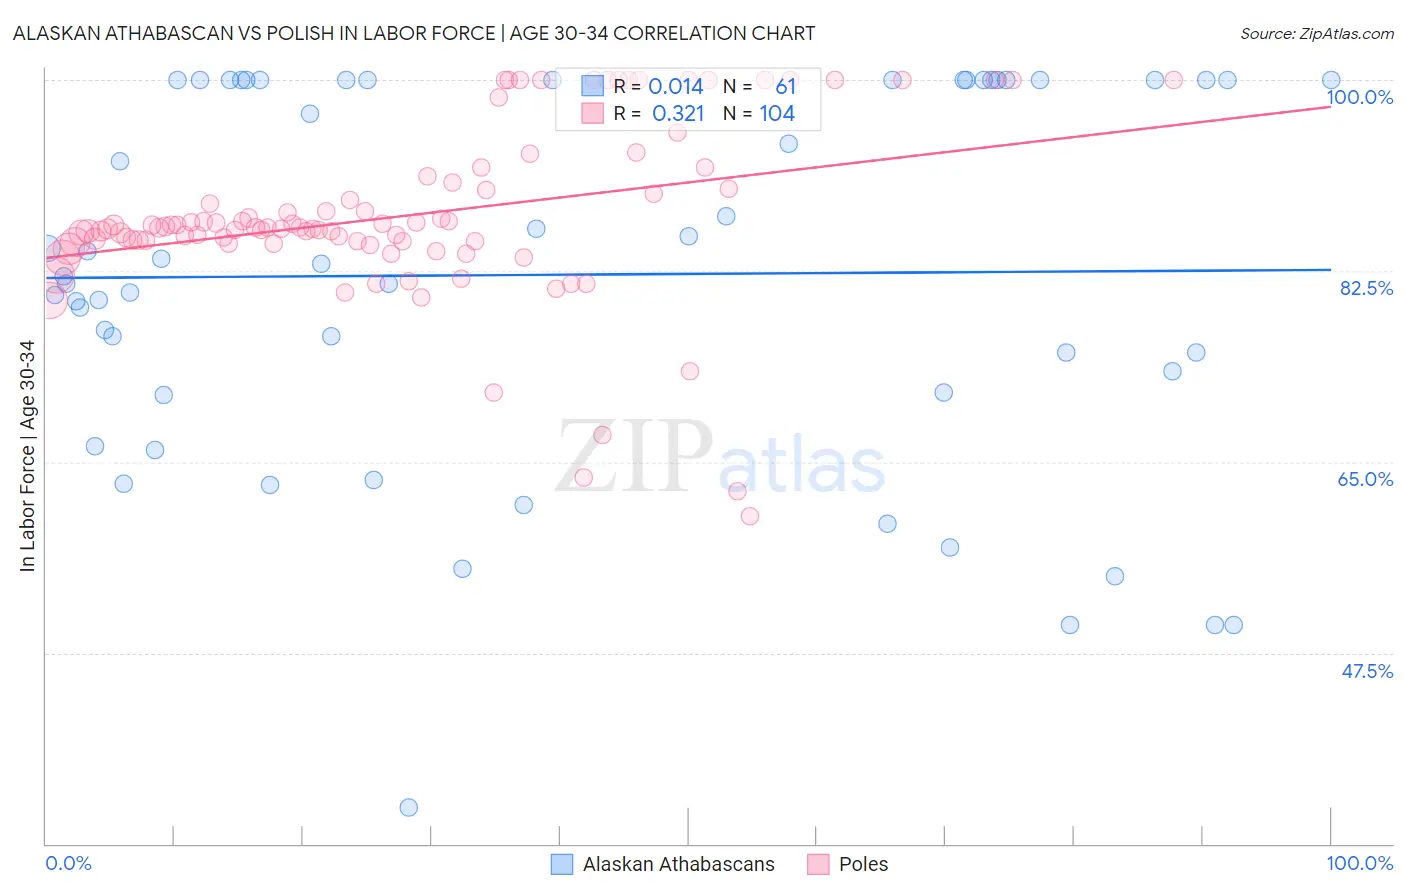
Alaskan Athabascan vs Polish In Labor Force | Age 30-34 Correlation Chart
The statistical analysis conducted on geographies consisting of 45,811,893 people shows no correlation between the proportion of Alaskan Athabascans and labor force participation rate among population between the ages 30 and 34 in the United States with a correlation coefficient (R) of 0.014 and weighted average of 81.7%. Similarly, the statistical analysis conducted on geographies consisting of 559,395,237 people shows a mild positive correlation between the proportion of Poles and labor force participation rate among population between the ages 30 and 34 in the United States with a correlation coefficient (R) of 0.321 and weighted average of 85.5%, a difference of 4.6%.
In Labor Force | Age 30-34 Correlation Summary
| Measurement | Alaskan Athabascan | Polish |
| Minimum | 33.3% | 60.0% |
| Maximum | 100.0% | 100.0% |
| Range | 66.7% | 40.0% |
| Mean | 82.2% | 87.5% |
| Median | 83.2% | 86.5% |
| Interquartile 25% (IQ1) | 71.3% | 85.2% |
| Interquartile 75% (IQ3) | 100.0% | 90.3% |
| Interquartile Range (IQR) | 28.7% | 5.1% |
| Standard Deviation (Sample) | 17.3% | 8.0% |
| Standard Deviation (Population) | 17.2% | 7.9% |
Similar Demographics by In Labor Force | Age 30-34
Demographics Similar to Alaskan Athabascans by In Labor Force | Age 30-34
In terms of in labor force | age 30-34, the demographic groups most similar to Alaskan Athabascans are Cherokee (81.6%, a difference of 0.10%), Iroquois (81.9%, a difference of 0.25%), Immigrants from the Azores (81.5%, a difference of 0.25%), Arapaho (81.5%, a difference of 0.26%), and Chickasaw (81.9%, a difference of 0.27%).
| Demographics | Rating | Rank | In Labor Force | Age 30-34 |
| Menominee | 0.0 /100 | #307 | Tragic 82.2% |
| Puget Sound Salish | 0.0 /100 | #308 | Tragic 82.1% |
| Immigrants | Mexico | 0.0 /100 | #309 | Tragic 82.0% |
| Cajuns | 0.0 /100 | #310 | Tragic 82.0% |
| Chickasaw | 0.0 /100 | #311 | Tragic 81.9% |
| Mexicans | 0.0 /100 | #312 | Tragic 81.9% |
| Iroquois | 0.0 /100 | #313 | Tragic 81.9% |
| Alaskan Athabascans | 0.0 /100 | #314 | Tragic 81.7% |
| Cherokee | 0.0 /100 | #315 | Tragic 81.6% |
| Immigrants | Azores | 0.0 /100 | #316 | Tragic 81.5% |
| Arapaho | 0.0 /100 | #317 | Tragic 81.5% |
| Choctaw | 0.0 /100 | #318 | Tragic 81.4% |
| Shoshone | 0.0 /100 | #319 | Tragic 81.4% |
| Yaqui | 0.0 /100 | #320 | Tragic 81.4% |
| Alaska Natives | 0.0 /100 | #321 | Tragic 81.3% |
Demographics Similar to Poles by In Labor Force | Age 30-34
In terms of in labor force | age 30-34, the demographic groups most similar to Poles are Russian (85.5%, a difference of 0.0%), Immigrants from Turkey (85.5%, a difference of 0.010%), Czech (85.5%, a difference of 0.010%), Immigrants from Poland (85.5%, a difference of 0.010%), and Immigrants from Kenya (85.5%, a difference of 0.020%).
| Demographics | Rating | Rank | In Labor Force | Age 30-34 |
| Cape Verdeans | 99.7 /100 | #51 | Exceptional 85.6% |
| Slovenes | 99.7 /100 | #52 | Exceptional 85.6% |
| Filipinos | 99.6 /100 | #53 | Exceptional 85.5% |
| Immigrants | Kenya | 99.6 /100 | #54 | Exceptional 85.5% |
| Immigrants | Turkey | 99.6 /100 | #55 | Exceptional 85.5% |
| Czechs | 99.6 /100 | #56 | Exceptional 85.5% |
| Russians | 99.6 /100 | #57 | Exceptional 85.5% |
| Poles | 99.6 /100 | #58 | Exceptional 85.5% |
| Immigrants | Poland | 99.5 /100 | #59 | Exceptional 85.5% |
| Immigrants | France | 99.5 /100 | #60 | Exceptional 85.5% |
| Immigrants | Brazil | 99.5 /100 | #61 | Exceptional 85.5% |
| Soviet Union | 99.4 /100 | #62 | Exceptional 85.5% |
| Macedonians | 99.4 /100 | #63 | Exceptional 85.5% |
| Italians | 99.4 /100 | #64 | Exceptional 85.4% |
| Senegalese | 99.4 /100 | #65 | Exceptional 85.4% |