Alaskan Athabascan vs Immigrants from Poland Unemployment Among Women with Children Under 18 years
COMPARE
Alaskan Athabascan
Immigrants from Poland
Unemployment Among Women with Children Under 18 years
Unemployment Among Women with Children Under 18 years Comparison
Alaskan Athabascans
Immigrants from Poland
6.3%
UNEMPLOYMENT AMONG WOMEN WITH CHILDREN UNDER 18 YEARS
0.0/ 100
METRIC RATING
286th/ 347
METRIC RANK
5.5%
UNEMPLOYMENT AMONG WOMEN WITH CHILDREN UNDER 18 YEARS
31.2/ 100
METRIC RATING
190th/ 347
METRIC RANK
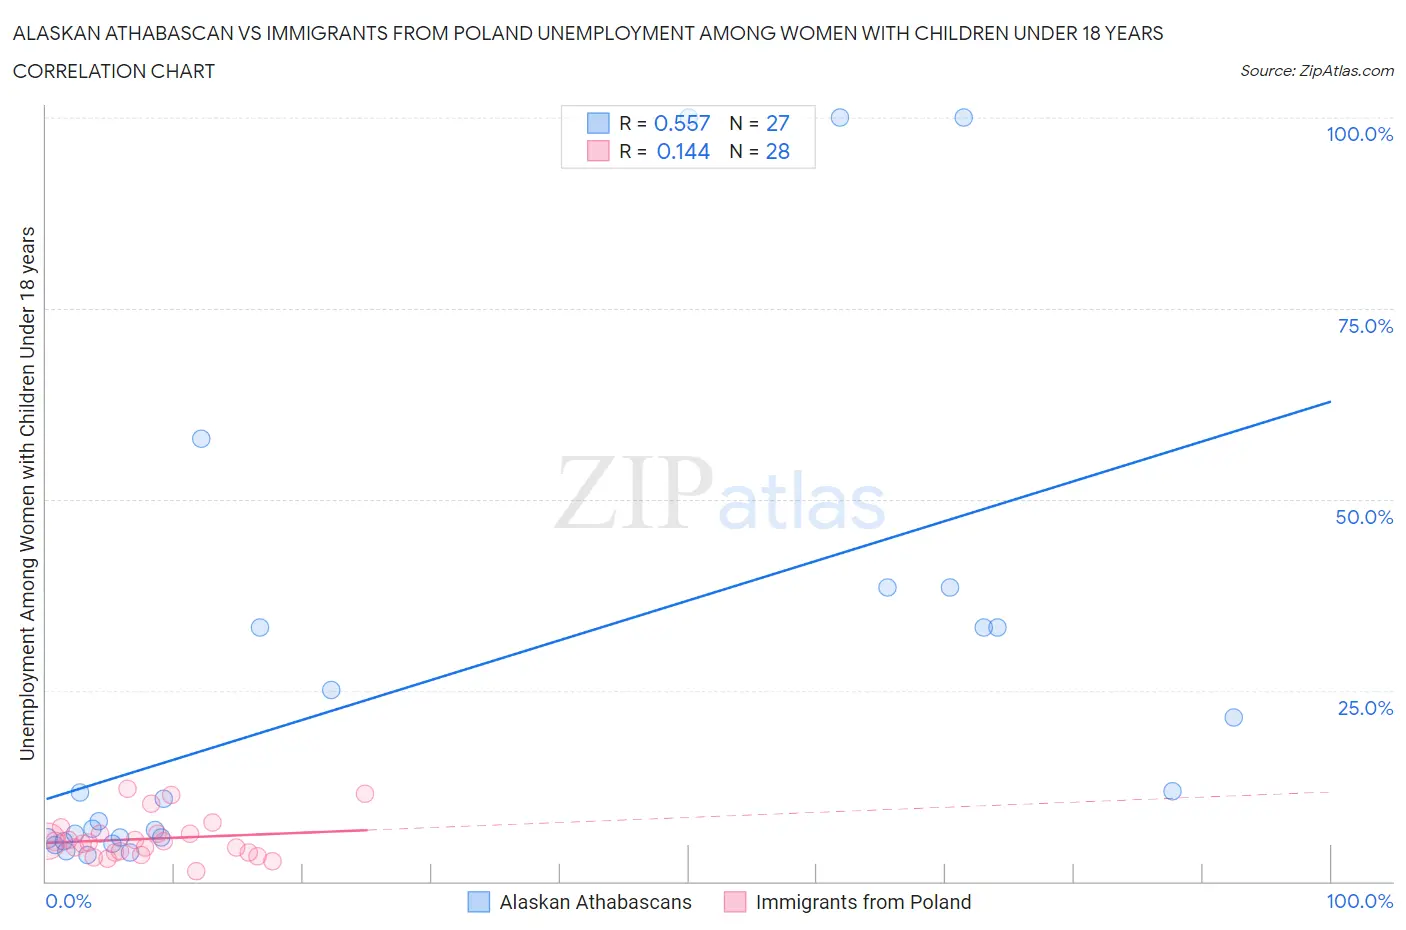
Alaskan Athabascan vs Immigrants from Poland Unemployment Among Women with Children Under 18 years Correlation Chart
The statistical analysis conducted on geographies consisting of 45,206,259 people shows a substantial positive correlation between the proportion of Alaskan Athabascans and unemployment rate among women with children under the age of 18 in the United States with a correlation coefficient (R) of 0.557 and weighted average of 6.3%. Similarly, the statistical analysis conducted on geographies consisting of 295,009,272 people shows a poor positive correlation between the proportion of Immigrants from Poland and unemployment rate among women with children under the age of 18 in the United States with a correlation coefficient (R) of 0.144 and weighted average of 5.5%, a difference of 14.6%.
Unemployment Among Women with Children Under 18 years Correlation Summary
| Measurement | Alaskan Athabascan | Immigrants from Poland |
| Minimum | 3.4% | 1.3% |
| Maximum | 100.0% | 12.1% |
| Range | 96.6% | 10.8% |
| Mean | 25.4% | 5.6% |
| Median | 10.8% | 5.1% |
| Interquartile 25% (IQ1) | 5.6% | 3.8% |
| Interquartile 75% (IQ3) | 33.3% | 6.2% |
| Interquartile Range (IQR) | 27.7% | 2.4% |
| Standard Deviation (Sample) | 30.4% | 2.7% |
| Standard Deviation (Population) | 29.9% | 2.7% |
Similar Demographics by Unemployment Among Women with Children Under 18 years
Demographics Similar to Alaskan Athabascans by Unemployment Among Women with Children Under 18 years
In terms of unemployment among women with children under 18 years, the demographic groups most similar to Alaskan Athabascans are Kiowa (6.3%, a difference of 0.010%), Cree (6.3%, a difference of 0.13%), Bahamian (6.3%, a difference of 0.15%), Immigrants from Grenada (6.3%, a difference of 0.30%), and West Indian (6.3%, a difference of 0.33%).
| Demographics | Rating | Rank | Unemployment Among Women with Children Under 18 years |
| Immigrants | Portugal | 0.0 /100 | #279 | Tragic 6.3% |
| Guatemalans | 0.0 /100 | #280 | Tragic 6.3% |
| Immigrants | El Salvador | 0.0 /100 | #281 | Tragic 6.3% |
| Immigrants | St. Vincent and the Grenadines | 0.0 /100 | #282 | Tragic 6.3% |
| West Indians | 0.0 /100 | #283 | Tragic 6.3% |
| Immigrants | Grenada | 0.0 /100 | #284 | Tragic 6.3% |
| Bahamians | 0.0 /100 | #285 | Tragic 6.3% |
| Alaskan Athabascans | 0.0 /100 | #286 | Tragic 6.3% |
| Kiowa | 0.0 /100 | #287 | Tragic 6.3% |
| Cree | 0.0 /100 | #288 | Tragic 6.3% |
| Immigrants | Caribbean | 0.0 /100 | #289 | Tragic 6.4% |
| Blackfeet | 0.0 /100 | #290 | Tragic 6.4% |
| Immigrants | Guatemala | 0.0 /100 | #291 | Tragic 6.4% |
| Mexicans | 0.0 /100 | #292 | Tragic 6.4% |
| Immigrants | Bangladesh | 0.0 /100 | #293 | Tragic 6.4% |
Demographics Similar to Immigrants from Poland by Unemployment Among Women with Children Under 18 years
In terms of unemployment among women with children under 18 years, the demographic groups most similar to Immigrants from Poland are South American Indian (5.5%, a difference of 0.030%), Immigrants from Spain (5.5%, a difference of 0.040%), Immigrants from Afghanistan (5.5%, a difference of 0.16%), Immigrants from Chile (5.5%, a difference of 0.17%), and Immigrants from Eritrea (5.5%, a difference of 0.21%).
| Demographics | Rating | Rank | Unemployment Among Women with Children Under 18 years |
| Immigrants | Laos | 38.8 /100 | #183 | Fair 5.5% |
| Immigrants | Cambodia | 38.4 /100 | #184 | Fair 5.5% |
| Immigrants | Zaire | 38.1 /100 | #185 | Fair 5.5% |
| Indonesians | 36.3 /100 | #186 | Fair 5.5% |
| Malaysians | 35.7 /100 | #187 | Fair 5.5% |
| Iraqis | 35.3 /100 | #188 | Fair 5.5% |
| Immigrants | Eritrea | 33.8 /100 | #189 | Fair 5.5% |
| Immigrants | Poland | 31.2 /100 | #190 | Fair 5.5% |
| South American Indians | 30.8 /100 | #191 | Fair 5.5% |
| Immigrants | Spain | 30.7 /100 | #192 | Fair 5.5% |
| Immigrants | Afghanistan | 29.3 /100 | #193 | Fair 5.5% |
| Immigrants | Chile | 29.2 /100 | #194 | Fair 5.5% |
| Colombians | 22.8 /100 | #195 | Fair 5.6% |
| Spaniards | 22.8 /100 | #196 | Fair 5.6% |
| Immigrants | Colombia | 21.4 /100 | #197 | Fair 5.6% |