Alaska Native vs French Canadian In Labor Force | Age 20-24
COMPARE
Alaska Native
French Canadian
In Labor Force | Age 20-24
In Labor Force | Age 20-24 Comparison
Alaska Natives
French Canadians
75.9%
IN LABOR FORCE | AGE 20-24
95.1/ 100
METRIC RATING
115th/ 347
METRIC RANK
78.1%
IN LABOR FORCE | AGE 20-24
100.0/ 100
METRIC RATING
20th/ 347
METRIC RANK
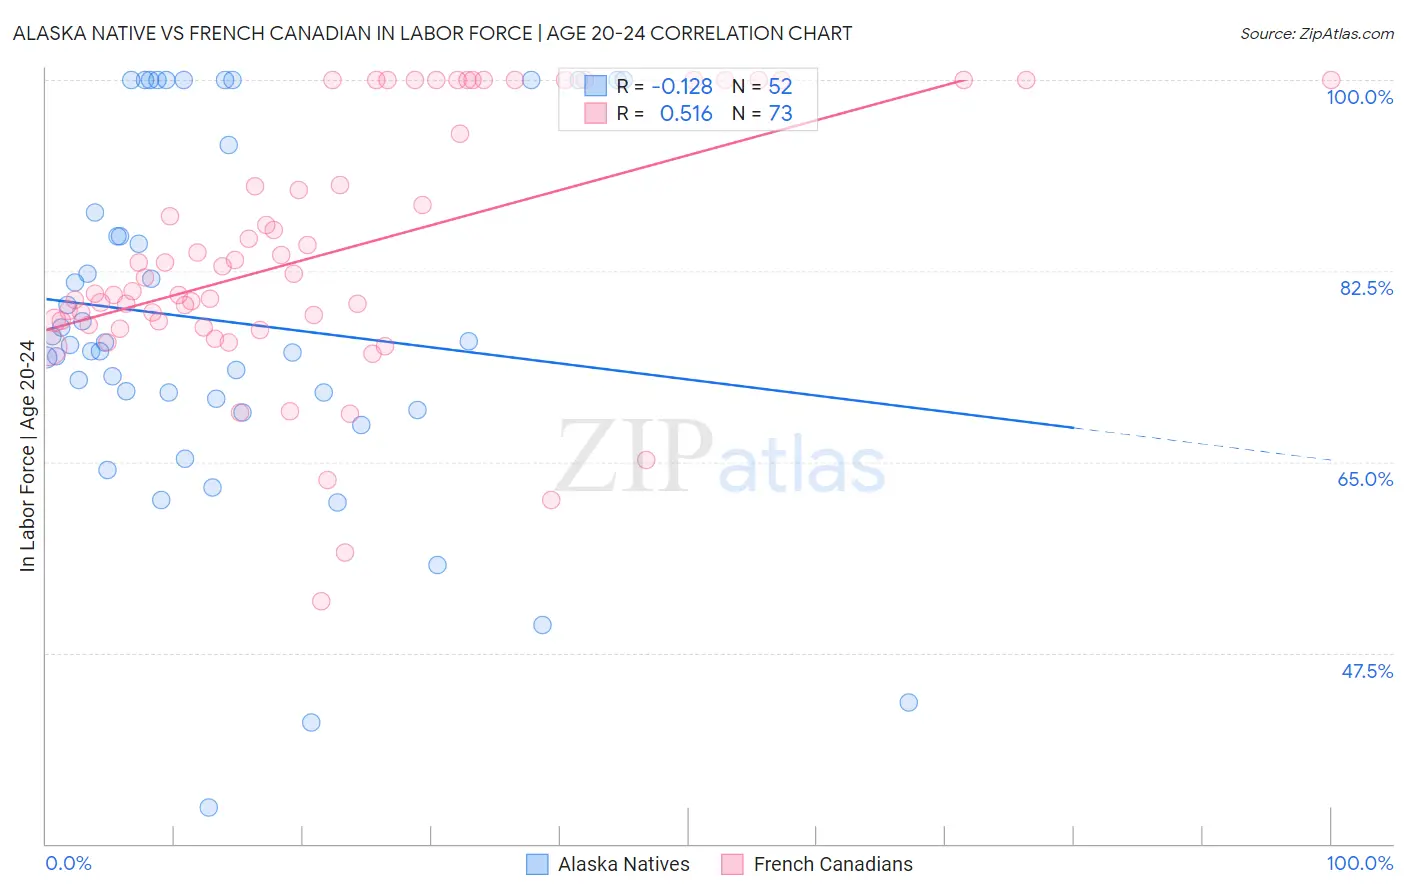
Alaska Native vs French Canadian In Labor Force | Age 20-24 Correlation Chart
The statistical analysis conducted on geographies consisting of 76,758,773 people shows a poor negative correlation between the proportion of Alaska Natives and labor force participation rate among population between the ages 20 and 24 in the United States with a correlation coefficient (R) of -0.128 and weighted average of 75.9%. Similarly, the statistical analysis conducted on geographies consisting of 502,046,996 people shows a substantial positive correlation between the proportion of French Canadians and labor force participation rate among population between the ages 20 and 24 in the United States with a correlation coefficient (R) of 0.516 and weighted average of 78.1%, a difference of 2.9%.
In Labor Force | Age 20-24 Correlation Summary
| Measurement | Alaska Native | French Canadian |
| Minimum | 33.3% | 52.3% |
| Maximum | 100.0% | 100.0% |
| Range | 66.7% | 47.7% |
| Mean | 77.8% | 84.2% |
| Median | 75.8% | 81.9% |
| Interquartile 25% (IQ1) | 70.3% | 77.7% |
| Interquartile 75% (IQ3) | 90.9% | 100.0% |
| Interquartile Range (IQR) | 20.7% | 22.3% |
| Standard Deviation (Sample) | 16.5% | 11.7% |
| Standard Deviation (Population) | 16.4% | 11.6% |
Similar Demographics by In Labor Force | Age 20-24
Demographics Similar to Alaska Natives by In Labor Force | Age 20-24
In terms of in labor force | age 20-24, the demographic groups most similar to Alaska Natives are Immigrants from Zimbabwe (75.9%, a difference of 0.0%), Immigrants from Netherlands (75.9%, a difference of 0.010%), Immigrants from North America (75.9%, a difference of 0.010%), Assyrian/Chaldean/Syriac (75.9%, a difference of 0.010%), and Spanish American (75.8%, a difference of 0.020%).
| Demographics | Rating | Rank | In Labor Force | Age 20-24 |
| Iraqis | 96.6 /100 | #108 | Exceptional 76.0% |
| Cherokee | 95.8 /100 | #109 | Exceptional 75.9% |
| Immigrants | Morocco | 95.8 /100 | #110 | Exceptional 75.9% |
| Ukrainians | 95.7 /100 | #111 | Exceptional 75.9% |
| Immigrants | Canada | 95.6 /100 | #112 | Exceptional 75.9% |
| Immigrants | Netherlands | 95.3 /100 | #113 | Exceptional 75.9% |
| Immigrants | Zimbabwe | 95.1 /100 | #114 | Exceptional 75.9% |
| Alaska Natives | 95.1 /100 | #115 | Exceptional 75.9% |
| Immigrants | North America | 95.0 /100 | #116 | Exceptional 75.9% |
| Assyrians/Chaldeans/Syriacs | 94.9 /100 | #117 | Exceptional 75.9% |
| Spanish Americans | 94.8 /100 | #118 | Exceptional 75.8% |
| Immigrants | Portugal | 94.8 /100 | #119 | Exceptional 75.8% |
| Immigrants | Africa | 94.6 /100 | #120 | Exceptional 75.8% |
| Immigrants | Serbia | 94.3 /100 | #121 | Exceptional 75.8% |
| Pakistanis | 94.1 /100 | #122 | Exceptional 75.8% |
Demographics Similar to French Canadians by In Labor Force | Age 20-24
In terms of in labor force | age 20-24, the demographic groups most similar to French Canadians are Immigrants from Bosnia and Herzegovina (78.1%, a difference of 0.070%), Bangladeshi (78.1%, a difference of 0.070%), Puget Sound Salish (78.0%, a difference of 0.070%), Pennsylvania German (78.0%, a difference of 0.12%), and Yugoslavian (78.0%, a difference of 0.14%).
| Demographics | Rating | Rank | In Labor Force | Age 20-24 |
| Scandinavians | 100.0 /100 | #13 | Exceptional 78.5% |
| Czechs | 100.0 /100 | #14 | Exceptional 78.5% |
| Sudanese | 100.0 /100 | #15 | Exceptional 78.4% |
| Dutch | 100.0 /100 | #16 | Exceptional 78.4% |
| Cape Verdeans | 100.0 /100 | #17 | Exceptional 78.3% |
| Immigrants | Bosnia and Herzegovina | 100.0 /100 | #18 | Exceptional 78.1% |
| Bangladeshis | 100.0 /100 | #19 | Exceptional 78.1% |
| French Canadians | 100.0 /100 | #20 | Exceptional 78.1% |
| Puget Sound Salish | 100.0 /100 | #21 | Exceptional 78.0% |
| Pennsylvania Germans | 100.0 /100 | #22 | Exceptional 78.0% |
| Yugoslavians | 100.0 /100 | #23 | Exceptional 78.0% |
| Liberians | 100.0 /100 | #24 | Exceptional 78.0% |
| Tlingit-Haida | 100.0 /100 | #25 | Exceptional 77.9% |
| Tongans | 100.0 /100 | #26 | Exceptional 77.9% |
| Immigrants | Micronesia | 100.0 /100 | #27 | Exceptional 77.8% |