Alaska Native vs Eastern European In Labor Force | Age 20-24
COMPARE
Alaska Native
Eastern European
In Labor Force | Age 20-24
In Labor Force | Age 20-24 Comparison
Alaska Natives
Eastern Europeans
75.9%
IN LABOR FORCE | AGE 20-24
95.1/ 100
METRIC RATING
115th/ 347
METRIC RANK
74.8%
IN LABOR FORCE | AGE 20-24
25.4/ 100
METRIC RATING
195th/ 347
METRIC RANK
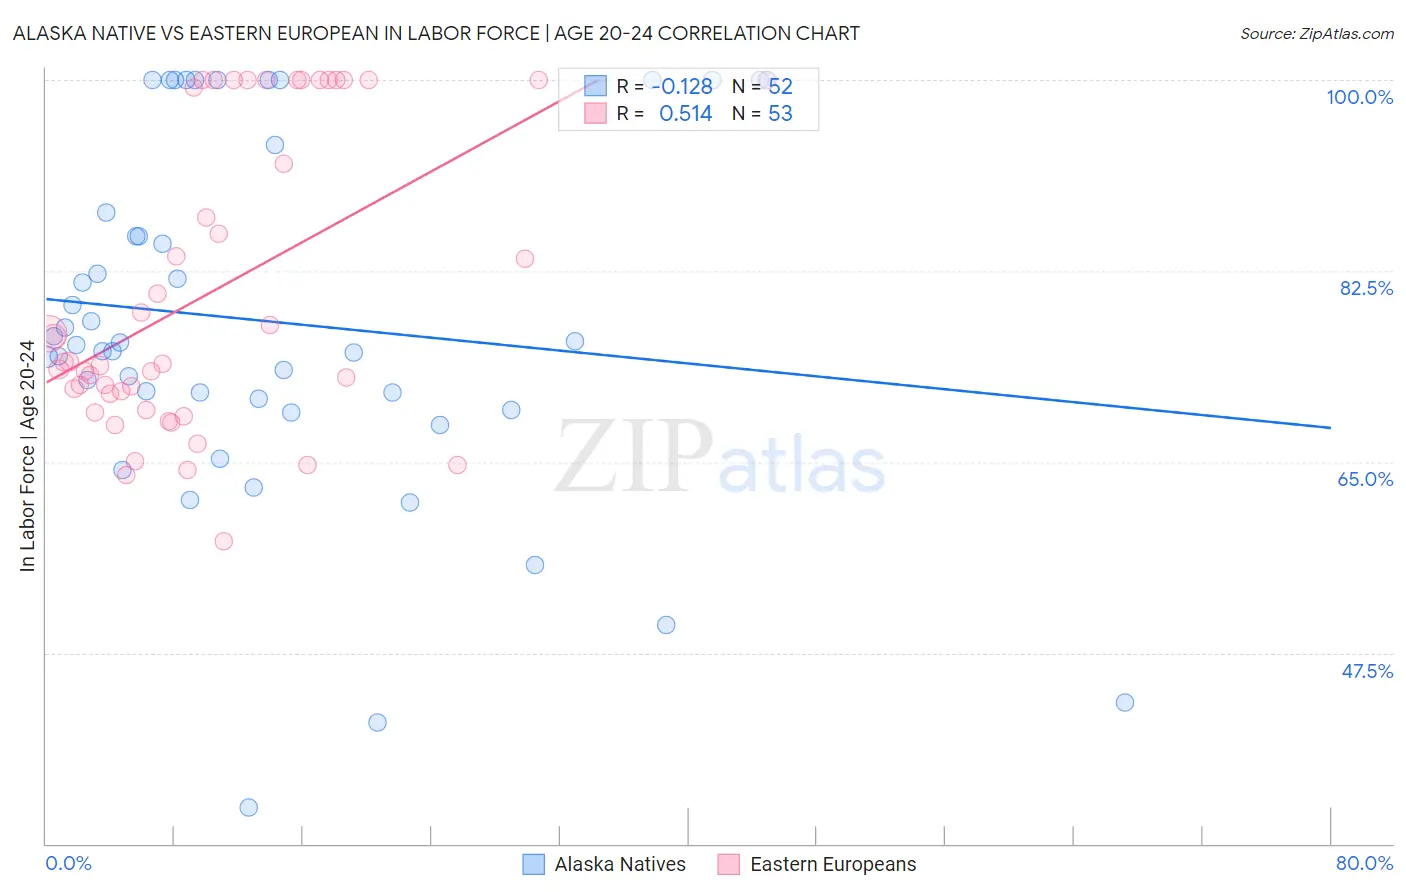
Alaska Native vs Eastern European In Labor Force | Age 20-24 Correlation Chart
The statistical analysis conducted on geographies consisting of 76,758,773 people shows a poor negative correlation between the proportion of Alaska Natives and labor force participation rate among population between the ages 20 and 24 in the United States with a correlation coefficient (R) of -0.128 and weighted average of 75.9%. Similarly, the statistical analysis conducted on geographies consisting of 460,874,706 people shows a substantial positive correlation between the proportion of Eastern Europeans and labor force participation rate among population between the ages 20 and 24 in the United States with a correlation coefficient (R) of 0.514 and weighted average of 74.8%, a difference of 1.5%.
In Labor Force | Age 20-24 Correlation Summary
| Measurement | Alaska Native | Eastern European |
| Minimum | 33.3% | 57.7% |
| Maximum | 100.0% | 100.0% |
| Range | 66.7% | 42.3% |
| Mean | 77.8% | 80.7% |
| Median | 75.8% | 74.1% |
| Interquartile 25% (IQ1) | 70.3% | 70.5% |
| Interquartile 75% (IQ3) | 90.9% | 100.0% |
| Interquartile Range (IQR) | 20.7% | 29.5% |
| Standard Deviation (Sample) | 16.5% | 13.6% |
| Standard Deviation (Population) | 16.4% | 13.5% |
Similar Demographics by In Labor Force | Age 20-24
Demographics Similar to Alaska Natives by In Labor Force | Age 20-24
In terms of in labor force | age 20-24, the demographic groups most similar to Alaska Natives are Immigrants from Zimbabwe (75.9%, a difference of 0.0%), Immigrants from Netherlands (75.9%, a difference of 0.010%), Immigrants from North America (75.9%, a difference of 0.010%), Assyrian/Chaldean/Syriac (75.9%, a difference of 0.010%), and Spanish American (75.8%, a difference of 0.020%).
| Demographics | Rating | Rank | In Labor Force | Age 20-24 |
| Iraqis | 96.6 /100 | #108 | Exceptional 76.0% |
| Cherokee | 95.8 /100 | #109 | Exceptional 75.9% |
| Immigrants | Morocco | 95.8 /100 | #110 | Exceptional 75.9% |
| Ukrainians | 95.7 /100 | #111 | Exceptional 75.9% |
| Immigrants | Canada | 95.6 /100 | #112 | Exceptional 75.9% |
| Immigrants | Netherlands | 95.3 /100 | #113 | Exceptional 75.9% |
| Immigrants | Zimbabwe | 95.1 /100 | #114 | Exceptional 75.9% |
| Alaska Natives | 95.1 /100 | #115 | Exceptional 75.9% |
| Immigrants | North America | 95.0 /100 | #116 | Exceptional 75.9% |
| Assyrians/Chaldeans/Syriacs | 94.9 /100 | #117 | Exceptional 75.9% |
| Spanish Americans | 94.8 /100 | #118 | Exceptional 75.8% |
| Immigrants | Portugal | 94.8 /100 | #119 | Exceptional 75.8% |
| Immigrants | Africa | 94.6 /100 | #120 | Exceptional 75.8% |
| Immigrants | Serbia | 94.3 /100 | #121 | Exceptional 75.8% |
| Pakistanis | 94.1 /100 | #122 | Exceptional 75.8% |
Demographics Similar to Eastern Europeans by In Labor Force | Age 20-24
In terms of in labor force | age 20-24, the demographic groups most similar to Eastern Europeans are Immigrants from Denmark (74.8%, a difference of 0.010%), Immigrants from Vietnam (74.7%, a difference of 0.010%), Panamanian (74.7%, a difference of 0.010%), Immigrants from Nigeria (74.7%, a difference of 0.020%), and Alsatian (74.8%, a difference of 0.030%).
| Demographics | Rating | Rank | In Labor Force | Age 20-24 |
| Hondurans | 32.7 /100 | #188 | Fair 74.8% |
| Immigrants | Northern Europe | 32.6 /100 | #189 | Fair 74.8% |
| Russians | 32.2 /100 | #190 | Fair 74.8% |
| Senegalese | 28.1 /100 | #191 | Fair 74.8% |
| Immigrants | Europe | 27.5 /100 | #192 | Fair 74.8% |
| Alsatians | 27.1 /100 | #193 | Fair 74.8% |
| Immigrants | Denmark | 25.8 /100 | #194 | Fair 74.8% |
| Eastern Europeans | 25.4 /100 | #195 | Fair 74.8% |
| Immigrants | Vietnam | 25.1 /100 | #196 | Fair 74.7% |
| Panamanians | 25.0 /100 | #197 | Fair 74.7% |
| Immigrants | Nigeria | 24.2 /100 | #198 | Fair 74.7% |
| Taiwanese | 23.2 /100 | #199 | Fair 74.7% |
| Nigerians | 21.9 /100 | #200 | Fair 74.7% |
| Choctaw | 21.4 /100 | #201 | Fair 74.7% |
| Moroccans | 20.4 /100 | #202 | Fair 74.7% |