Immigrants from Latin America vs French Canadian In Labor Force | Age 20-24

COMPARE

Immigrants from Latin America
Race
Ancestry
AfghanAfricanAlaska NativeAlaskan AthabascanAlbanianAleutAlsatianAmericanApacheArabArapahoArgentineanArmenianAssyrian/Chaldean/SyriacAustralianAustrianBahamianBangladeshiBarbadianBasqueBelgianBelizeanBermudanBhutaneseBlackfeetBolivianBrazilianBritishBritish West IndianBulgarianBurmeseCajunCambodianCanadianCape VerdeanCarpatho RusynCelticCentral AmericanCentral American IndianCherokeeCheyenneChickasawChileanChineseChippewaChoctawColombianColvilleComancheCosta RicanCreeCreekCroatianCrowCubanCypriotCzechCzechoslovakianDanishDelawareDominicanDutchDutch West IndianEastern EuropeanEcuadorianEgyptianEnglishEstonianEthiopianEuropeanFijianFilipinoFinnishFrenchFrench American IndianGermanGerman RussianGhanaianGreekGuamanian/ChamorroGuatemalanGuyaneseHaitianHmongHonduranHopiHoumaHungarianIcelanderIndian (Asian)IndonesianInupiatIranianIraqiIrishIroquoisIsraeliItalianJamaicanJapaneseJordanianKenyanKiowaKoreanLaotianLatvianLebaneseLiberianLithuanianLumbeeLuxembourgerMacedonianMalaysianMalteseMarshalleseMenomineeMexicanMexican American IndianMongolianMoroccanNative HawaiianNavajoNepaleseNew ZealanderNicaraguanNigerianNorthern EuropeanNorwegianOkinawanOsageOttawaPaiutePakistaniPalestinianPanamanianParaguayanPennsylvania GermanPeruvianPimaPolishPortuguesePotawatomiPuebloPuerto RicanPuget Sound SalishRomanianRussianSalvadoranSamoanScandinavianScotch-IrishScottishSeminoleSenegaleseSerbianShoshoneSierra LeoneanSiouxSlavicSlovakSloveneSomaliSouth AfricanSouth AmericanSouth American IndianSoviet UnionSpaniardSpanishSpanish AmericanSpanish American IndianSri LankanSubsaharan AfricanSudaneseSwedishSwissSyrianTaiwaneseThaiTlingit-HaidaTohono O'OdhamTonganTrinidadian and TobagonianTsimshianTurkishU.S. Virgin IslanderUgandanUkrainianUruguayanUteVenezuelanVietnameseWelshWest IndianYakamaYaquiYugoslavianYumanYup'ikZimbabwean
Immigration
NonimmigrantsImmigrantsAfghanistanAfricaAlbaniaArgentinaArmeniaAsiaAustraliaAustriaBahamasBangladeshBarbadosBelarusBelgiumBelizeBoliviaBosnia and HerzegovinaBrazilBulgariaBurma/MyanmarCabo VerdeCambodiaCameroonCanadaCaribbeanCentral AmericaChileChinaColombiaCongoCosta RicaCroatiaCubaCzechoslovakiaDenmarkDominicaDominican RepublicEastern AfricaEastern AsiaEastern EuropeEcuadorEgyptEl SalvadorEnglandEritreaEthiopiaEuropeFijiFranceGermanyGhanaGreeceGrenadaGuatemalaGuyanaHaitiHondurasHong KongHungaryIndiaIndonesiaIranIraqIrelandIsraelItalyJamaicaJapanJordanKazakhstanKenyaKoreaKuwaitLaosLatin AmericaLatviaLebanonLiberiaLithuaniaMalaysiaMexicoMicronesiaMiddle AfricaMoldovaMoroccoNepalNetherlandsNicaraguaNigeriaNorth AmericaNorth MacedoniaNorthern AfricaNorthern EuropeNorwayOceaniaPakistanPanamaPeruPhilippinesPolandPortugalRomaniaRussiaSaudi ArabiaScotlandSenegalSerbiaSierra LeoneSingaporeSomaliaSouth AfricaSouth AmericaSouth Central AsiaSouth Eastern AsiaSouthern EuropeSpainSri LankaSt. Vincent and the GrenadinesSudanSwedenSwitzerlandSyriaTaiwanThailandTrinidad and TobagoTurkeyUgandaUkraineUruguayUzbekistanVenezuelaVietnamWest IndiesWestern AfricaWestern AsiaWestern EuropeYemenZaireZimbabweAzores
French Canadian
Race
Ancestry
AfghanAfricanAlaska NativeAlaskan AthabascanAlbanianAleutAlsatianAmericanApacheArabArapahoArgentineanArmenianAssyrian/Chaldean/SyriacAustralianAustrianBahamianBangladeshiBarbadianBasqueBelgianBelizeanBermudanBhutaneseBlackfeetBolivianBrazilianBritishBritish West IndianBulgarianBurmeseCajunCambodianCanadianCape VerdeanCarpatho RusynCelticCentral AmericanCentral American IndianCherokeeCheyenneChickasawChileanChineseChippewaChoctawColombianColvilleComancheCosta RicanCreeCreekCroatianCrowCubanCypriotCzechCzechoslovakianDanishDelawareDominicanDutchDutch West IndianEastern EuropeanEcuadorianEgyptianEnglishEstonianEthiopianEuropeanFijianFilipinoFinnishFrenchFrench American IndianFrench CanadianGermanGerman RussianGhanaianGreekGuamanian/ChamorroGuatemalanGuyaneseHaitianHmongHonduranHopiHoumaHungarianIcelanderIndian (Asian)IndonesianInupiatIranianIraqiIrishIroquoisIsraeliItalianJamaicanJapaneseJordanianKenyanKiowaKoreanLaotianLatvianLebaneseLiberianLithuanianLumbeeLuxembourgerMacedonianMalaysianMalteseMarshalleseMenomineeMexicanMexican American IndianMongolianMoroccanNative HawaiianNavajoNepaleseNew ZealanderNicaraguanNigerianNorthern EuropeanNorwegianOkinawanOsageOttawaPaiutePakistaniPalestinianPanamanianParaguayanPennsylvania GermanPeruvianPimaPolishPortuguesePotawatomiPuebloPuerto RicanPuget Sound SalishRomanianRussianSalvadoranSamoanScandinavianScotch-IrishScottishSeminoleSenegaleseSerbianShoshoneSierra LeoneanSiouxSlavicSlovakSloveneSomaliSouth AfricanSouth AmericanSouth American IndianSoviet UnionSpaniardSpanishSpanish AmericanSpanish American IndianSri LankanSubsaharan AfricanSudaneseSwedishSwissSyrianTaiwaneseThaiTlingit-HaidaTohono O'OdhamTonganTrinidadian and TobagonianTsimshianTurkishU.S. Virgin IslanderUgandanUkrainianUruguayanUteVenezuelanVietnameseWelshWest IndianYakamaYaquiYugoslavianYumanYup'ikZimbabwean
Immigration
NonimmigrantsImmigrantsAfghanistanAfricaAlbaniaArgentinaArmeniaAsiaAustraliaAustriaBahamasBangladeshBarbadosBelarusBelgiumBelizeBoliviaBosnia and HerzegovinaBrazilBulgariaBurma/MyanmarCabo VerdeCambodiaCameroonCanadaCaribbeanCentral AmericaChileChinaColombiaCongoCosta RicaCroatiaCubaCzechoslovakiaDenmarkDominicaDominican RepublicEastern AfricaEastern AsiaEastern EuropeEcuadorEgyptEl SalvadorEnglandEritreaEthiopiaEuropeFijiFranceGermanyGhanaGreeceGrenadaGuatemalaGuyanaHaitiHondurasHong KongHungaryIndiaIndonesiaIranIraqIrelandIsraelItalyJamaicaJapanJordanKazakhstanKenyaKoreaKuwaitLaosLatviaLebanonLiberiaLithuaniaMalaysiaMexicoMicronesiaMiddle AfricaMoldovaMoroccoNepalNetherlandsNicaraguaNigeriaNorth AmericaNorth MacedoniaNorthern AfricaNorthern EuropeNorwayOceaniaPakistanPanamaPeruPhilippinesPolandPortugalRomaniaRussiaSaudi ArabiaScotlandSenegalSerbiaSierra LeoneSingaporeSomaliaSouth AfricaSouth AmericaSouth Central AsiaSouth Eastern AsiaSouthern EuropeSpainSri LankaSt. Vincent and the GrenadinesSudanSwedenSwitzerlandSyriaTaiwanThailandTrinidad and TobagoTurkeyUgandaUkraineUruguayUzbekistanVenezuelaVietnamWest IndiesWestern AfricaWestern AsiaWestern EuropeYemenZaireZimbabweAzores
In Labor Force | Age 20-24
Income
Poverty
Unemployment
Labor Participation
Family Structure
Vehicle Availability
Education Level
Disability

In Labor Force | Age 20-24 Comparison

Immigrants from Latin America

French Canadians

Tragic
Exceptional
74.1%
IN LABOR FORCE | AGE 20-24
2.7/ 100
METRIC RATING
239th/ 347
METRIC RANK
78.1%
IN LABOR FORCE | AGE 20-24
100.0/ 100
METRIC RATING
20th/ 347
METRIC RANK

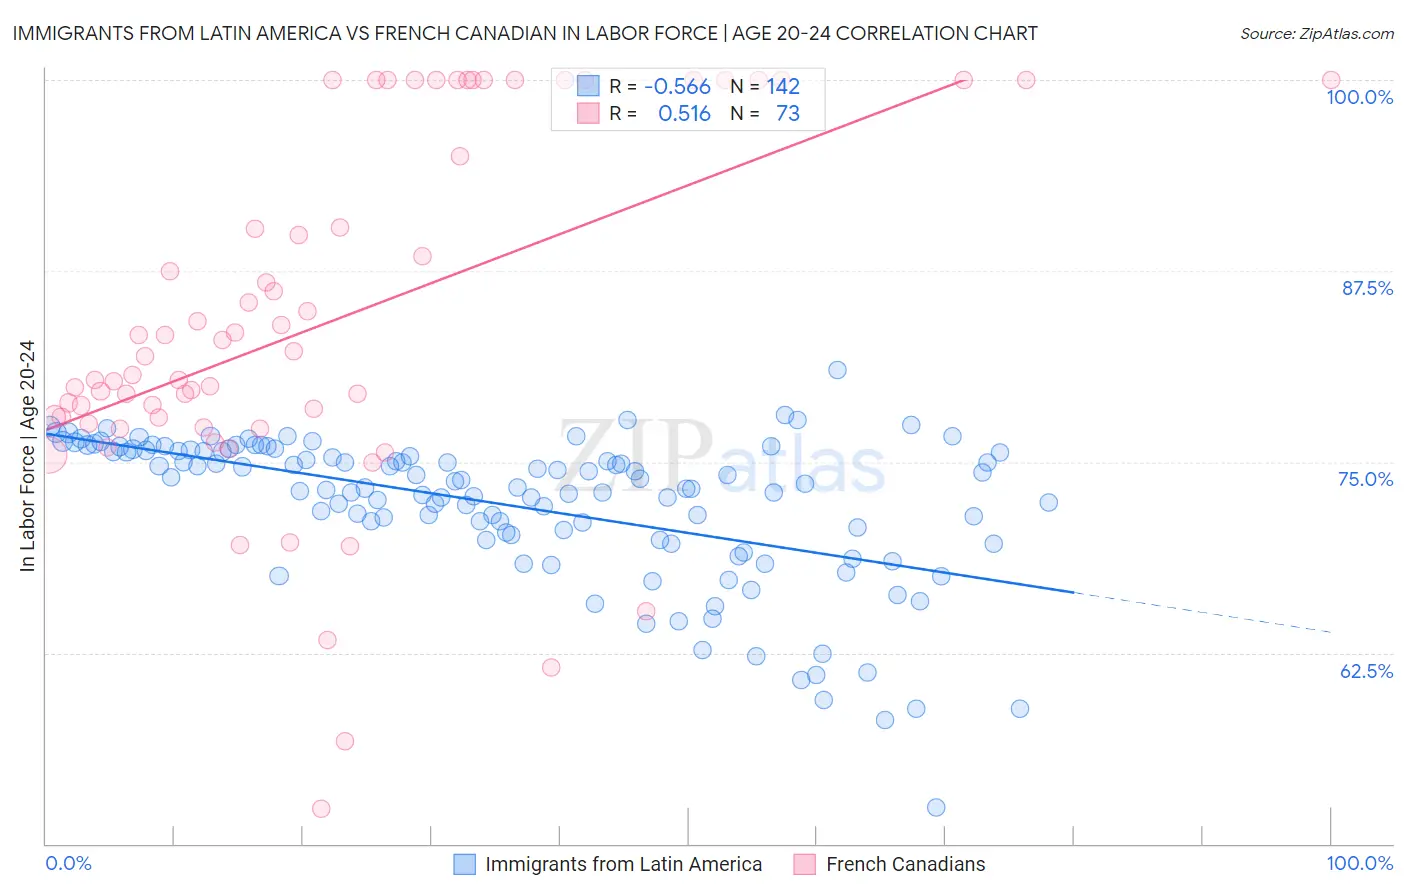
Immigrants from Latin America vs French Canadian In Labor Force | Age 20-24 Correlation Chart

The statistical analysis conducted on geographies consisting of 557,642,628 people shows a substantial negative correlation between the proportion of Immigrants from Latin America and labor force participation rate among population between the ages 20 and 24 in the United States with a correlation coefficient (R) of -0.566 and weighted average of 74.1%. Similarly, the statistical analysis conducted on geographies consisting of 502,046,996 people shows a substantial positive correlation between the proportion of French Canadians and labor force participation rate among population between the ages 20 and 24 in the United States with a correlation coefficient (R) of 0.516 and weighted average of 78.1%, a difference of 5.4%.
Immigrants from Latin America vs French Canadian In Labor Force | Age 20-24

In Labor Force | Age 20-24 Correlation Summary

MeasurementImmigrants from Latin AmericaFrench Canadian
Minimum52.4%52.3%
Maximum81.0%100.0%
Range28.6%47.7%
Mean72.2%84.2%
Median73.5%81.9%
Interquartile 25% (IQ1)70.2%77.7%
Interquartile 75% (IQ3)75.7%100.0%
Interquartile Range (IQR)5.6%22.3%
Standard Deviation (Sample)4.9%11.7%
Standard Deviation (Population)4.9%11.6%

Similar Demographics by In Labor Force | Age 20-24

Demographics Similar to Immigrants from Latin America by In Labor Force | Age 20-24

In terms of in labor force | age 20-24, the demographic groups most similar to Immigrants from Latin America are Immigrants from Japan (74.1%, a difference of 0.040%), Immigrants from Sri Lanka (74.0%, a difference of 0.060%), Bermudan (74.1%, a difference of 0.070%), Immigrants from France (74.1%, a difference of 0.090%), and Immigrants from Senegal (74.0%, a difference of 0.090%).
DemographicsRating | RankIn Labor Force | Age 20-24
Immigrants | Switzerland
4.1
/100
|
#232
Tragic
74.2%
Immigrants | Chile
3.7
/100
|
#233
Tragic
74.1%
Immigrants | Immigrants
3.6
/100
|
#234
Tragic
74.1%
Laotians
3.5
/100
|
#235
Tragic
74.1%
Immigrants | France
3.3
/100
|
#236
Tragic
74.1%
Bermudans
3.2
/100
|
#237
Tragic
74.1%
Immigrants | Japan
3.0
/100
|
#238
Tragic
74.1%
Immigrants | Latin America
2.7
/100
|
#239
Tragic
74.1%
Immigrants | Sri Lanka
2.3
/100
|
#240
Tragic
74.0%
Immigrants | Senegal
2.1
/100
|
#241
Tragic
74.0%
Thais
2.1
/100
|
#242
Tragic
74.0%
Immigrants | Syria
1.9
/100
|
#243
Tragic
74.0%
Immigrants | South Central Asia
1.9
/100
|
#244
Tragic
74.0%
Turks
1.8
/100
|
#245
Tragic
73.9%
Immigrants | Panama
1.6
/100
|
#246
Tragic
73.9%

Demographics Similar to French Canadians by In Labor Force | Age 20-24

In terms of in labor force | age 20-24, the demographic groups most similar to French Canadians are Immigrants from Bosnia and Herzegovina (78.1%, a difference of 0.070%), Bangladeshi (78.1%, a difference of 0.070%), Puget Sound Salish (78.0%, a difference of 0.070%), Pennsylvania German (78.0%, a difference of 0.12%), and Yugoslavian (78.0%, a difference of 0.14%).
DemographicsRating | RankIn Labor Force | Age 20-24
Scandinavians
100.0
/100
|
#13
Exceptional
78.5%
Czechs
100.0
/100
|
#14
Exceptional
78.5%
Sudanese
100.0
/100
|
#15
Exceptional
78.4%
Dutch
100.0
/100
|
#16
Exceptional
78.4%
Cape Verdeans
100.0
/100
|
#17
Exceptional
78.3%
Immigrants | Bosnia and Herzegovina
100.0
/100
|
#18
Exceptional
78.1%
Bangladeshis
100.0
/100
|
#19
Exceptional
78.1%
French Canadians
100.0
/100
|
#20
Exceptional
78.1%
Puget Sound Salish
100.0
/100
|
#21
Exceptional
78.0%
Pennsylvania Germans
100.0
/100
|
#22
Exceptional
78.0%
Yugoslavians
100.0
/100
|
#23
Exceptional
78.0%
Liberians
100.0
/100
|
#24
Exceptional
78.0%
Tlingit-Haida
100.0
/100
|
#25
Exceptional
77.9%
Tongans
100.0
/100
|
#26
Exceptional
77.9%
Immigrants | Micronesia
100.0
/100
|
#27
Exceptional
77.8%