Burmese vs French Canadian In Labor Force | Age 20-24
COMPARE
Burmese
French Canadian
In Labor Force | Age 20-24
In Labor Force | Age 20-24 Comparison
Burmese
French Canadians
73.6%
IN LABOR FORCE | AGE 20-24
0.5/ 100
METRIC RATING
265th/ 347
METRIC RANK
78.1%
IN LABOR FORCE | AGE 20-24
100.0/ 100
METRIC RATING
20th/ 347
METRIC RANK
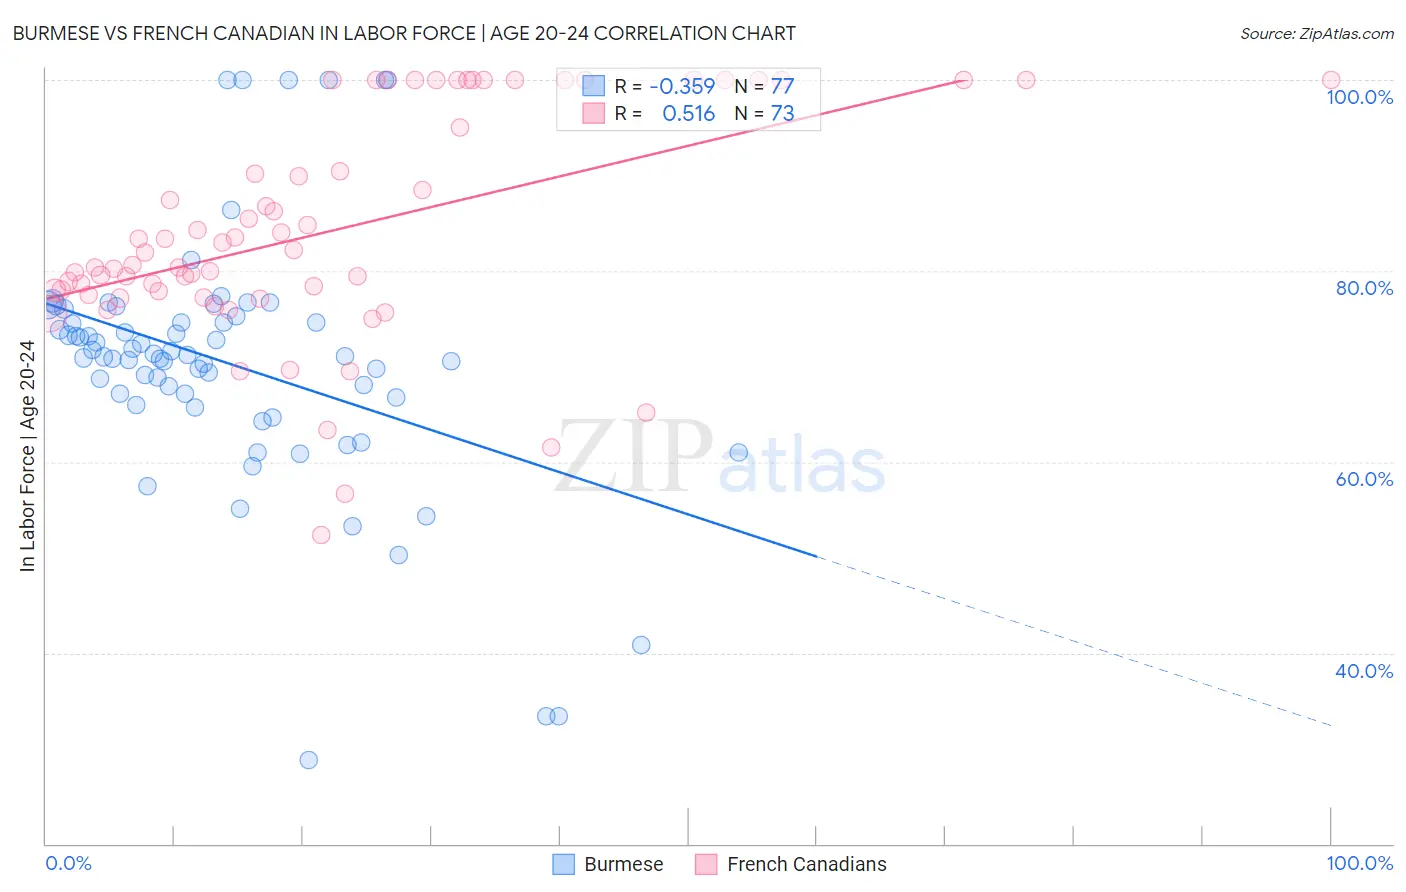
Burmese vs French Canadian In Labor Force | Age 20-24 Correlation Chart
The statistical analysis conducted on geographies consisting of 465,182,635 people shows a mild negative correlation between the proportion of Burmese and labor force participation rate among population between the ages 20 and 24 in the United States with a correlation coefficient (R) of -0.359 and weighted average of 73.6%. Similarly, the statistical analysis conducted on geographies consisting of 502,046,996 people shows a substantial positive correlation between the proportion of French Canadians and labor force participation rate among population between the ages 20 and 24 in the United States with a correlation coefficient (R) of 0.516 and weighted average of 78.1%, a difference of 6.1%.
In Labor Force | Age 20-24 Correlation Summary
| Measurement | Burmese | French Canadian |
| Minimum | 28.8% | 52.3% |
| Maximum | 100.0% | 100.0% |
| Range | 71.2% | 47.7% |
| Mean | 70.4% | 84.2% |
| Median | 71.0% | 81.9% |
| Interquartile 25% (IQ1) | 66.3% | 77.7% |
| Interquartile 75% (IQ3) | 75.0% | 100.0% |
| Interquartile Range (IQR) | 8.7% | 22.3% |
| Standard Deviation (Sample) | 13.4% | 11.7% |
| Standard Deviation (Population) | 13.3% | 11.6% |
Similar Demographics by In Labor Force | Age 20-24
Demographics Similar to Burmese by In Labor Force | Age 20-24
In terms of in labor force | age 20-24, the demographic groups most similar to Burmese are Haitian (73.6%, a difference of 0.0%), Immigrants from Haiti (73.6%, a difference of 0.010%), Immigrants from Asia (73.6%, a difference of 0.020%), Immigrants from Western Asia (73.5%, a difference of 0.040%), and South American (73.5%, a difference of 0.090%).
| Demographics | Rating | Rank | In Labor Force | Age 20-24 |
| Egyptians | 0.7 /100 | #258 | Tragic 73.7% |
| Dutch West Indians | 0.7 /100 | #259 | Tragic 73.7% |
| Immigrants | Turkey | 0.7 /100 | #260 | Tragic 73.7% |
| Houma | 0.6 /100 | #261 | Tragic 73.7% |
| Asians | 0.6 /100 | #262 | Tragic 73.7% |
| Immigrants | Asia | 0.5 /100 | #263 | Tragic 73.6% |
| Immigrants | Haiti | 0.5 /100 | #264 | Tragic 73.6% |
| Burmese | 0.5 /100 | #265 | Tragic 73.6% |
| Haitians | 0.5 /100 | #266 | Tragic 73.6% |
| Immigrants | Western Asia | 0.4 /100 | #267 | Tragic 73.5% |
| South Americans | 0.4 /100 | #268 | Tragic 73.5% |
| Colombians | 0.3 /100 | #269 | Tragic 73.5% |
| Immigrants | Russia | 0.3 /100 | #270 | Tragic 73.5% |
| Immigrants | Indonesia | 0.3 /100 | #271 | Tragic 73.4% |
| Belizeans | 0.3 /100 | #272 | Tragic 73.4% |
Demographics Similar to French Canadians by In Labor Force | Age 20-24
In terms of in labor force | age 20-24, the demographic groups most similar to French Canadians are Immigrants from Bosnia and Herzegovina (78.1%, a difference of 0.070%), Bangladeshi (78.1%, a difference of 0.070%), Puget Sound Salish (78.0%, a difference of 0.070%), Pennsylvania German (78.0%, a difference of 0.12%), and Yugoslavian (78.0%, a difference of 0.14%).
| Demographics | Rating | Rank | In Labor Force | Age 20-24 |
| Scandinavians | 100.0 /100 | #13 | Exceptional 78.5% |
| Czechs | 100.0 /100 | #14 | Exceptional 78.5% |
| Sudanese | 100.0 /100 | #15 | Exceptional 78.4% |
| Dutch | 100.0 /100 | #16 | Exceptional 78.4% |
| Cape Verdeans | 100.0 /100 | #17 | Exceptional 78.3% |
| Immigrants | Bosnia and Herzegovina | 100.0 /100 | #18 | Exceptional 78.1% |
| Bangladeshis | 100.0 /100 | #19 | Exceptional 78.1% |
| French Canadians | 100.0 /100 | #20 | Exceptional 78.1% |
| Puget Sound Salish | 100.0 /100 | #21 | Exceptional 78.0% |
| Pennsylvania Germans | 100.0 /100 | #22 | Exceptional 78.0% |
| Yugoslavians | 100.0 /100 | #23 | Exceptional 78.0% |
| Liberians | 100.0 /100 | #24 | Exceptional 78.0% |
| Tlingit-Haida | 100.0 /100 | #25 | Exceptional 77.9% |
| Tongans | 100.0 /100 | #26 | Exceptional 77.9% |
| Immigrants | Micronesia | 100.0 /100 | #27 | Exceptional 77.8% |