Immigrants from Poland vs French Canadian In Labor Force | Age 20-24
COMPARE
Immigrants from Poland
French Canadian
In Labor Force | Age 20-24
In Labor Force | Age 20-24 Comparison
Immigrants from Poland
French Canadians
76.1%
IN LABOR FORCE | AGE 20-24
97.7/ 100
METRIC RATING
101st/ 347
METRIC RANK
78.1%
IN LABOR FORCE | AGE 20-24
100.0/ 100
METRIC RATING
20th/ 347
METRIC RANK
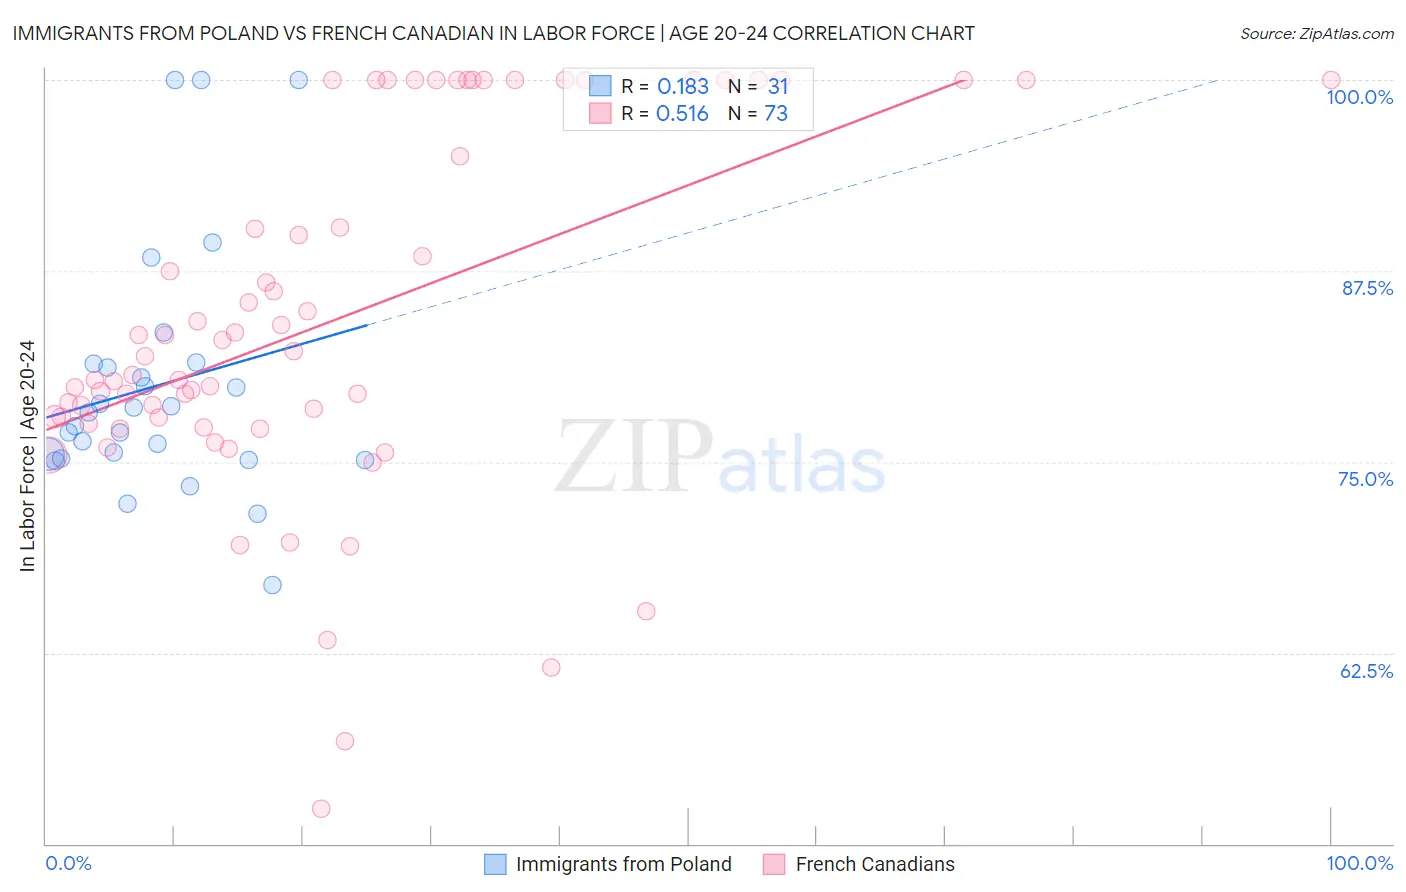
Immigrants from Poland vs French Canadian In Labor Force | Age 20-24 Correlation Chart
The statistical analysis conducted on geographies consisting of 304,736,963 people shows a poor positive correlation between the proportion of Immigrants from Poland and labor force participation rate among population between the ages 20 and 24 in the United States with a correlation coefficient (R) of 0.183 and weighted average of 76.1%. Similarly, the statistical analysis conducted on geographies consisting of 502,046,996 people shows a substantial positive correlation between the proportion of French Canadians and labor force participation rate among population between the ages 20 and 24 in the United States with a correlation coefficient (R) of 0.516 and weighted average of 78.1%, a difference of 2.6%.
In Labor Force | Age 20-24 Correlation Summary
| Measurement | Immigrants from Poland | French Canadian |
| Minimum | 66.9% | 52.3% |
| Maximum | 100.0% | 100.0% |
| Range | 33.1% | 47.7% |
| Mean | 80.0% | 84.2% |
| Median | 78.2% | 81.9% |
| Interquartile 25% (IQ1) | 75.2% | 77.7% |
| Interquartile 75% (IQ3) | 81.5% | 100.0% |
| Interquartile Range (IQR) | 6.3% | 22.3% |
| Standard Deviation (Sample) | 8.0% | 11.7% |
| Standard Deviation (Population) | 7.9% | 11.6% |
Similar Demographics by In Labor Force | Age 20-24
Demographics Similar to Immigrants from Poland by In Labor Force | Age 20-24
In terms of in labor force | age 20-24, the demographic groups most similar to Immigrants from Poland are Latvian (76.1%, a difference of 0.010%), American (76.1%, a difference of 0.020%), Shoshone (76.1%, a difference of 0.020%), Immigrants from North Macedonia (76.1%, a difference of 0.030%), and Immigrants from Lithuania (76.1%, a difference of 0.050%).
| Demographics | Rating | Rank | In Labor Force | Age 20-24 |
| Potawatomi | 98.5 /100 | #94 | Exceptional 76.2% |
| Immigrants | Germany | 98.5 /100 | #95 | Exceptional 76.2% |
| Immigrants | Nonimmigrants | 98.5 /100 | #96 | Exceptional 76.2% |
| Immigrants | Lithuania | 98.0 /100 | #97 | Exceptional 76.1% |
| Immigrants | Oceania | 98.0 /100 | #98 | Exceptional 76.1% |
| Americans | 97.8 /100 | #99 | Exceptional 76.1% |
| Shoshone | 97.8 /100 | #100 | Exceptional 76.1% |
| Immigrants | Poland | 97.7 /100 | #101 | Exceptional 76.1% |
| Latvians | 97.6 /100 | #102 | Exceptional 76.1% |
| Immigrants | North Macedonia | 97.5 /100 | #103 | Exceptional 76.1% |
| Macedonians | 97.2 /100 | #104 | Exceptional 76.0% |
| Immigrants | Nepal | 97.2 /100 | #105 | Exceptional 76.0% |
| Immigrants | Uganda | 97.1 /100 | #106 | Exceptional 76.0% |
| Greeks | 96.9 /100 | #107 | Exceptional 76.0% |
| Iraqis | 96.6 /100 | #108 | Exceptional 76.0% |
Demographics Similar to French Canadians by In Labor Force | Age 20-24
In terms of in labor force | age 20-24, the demographic groups most similar to French Canadians are Immigrants from Bosnia and Herzegovina (78.1%, a difference of 0.070%), Bangladeshi (78.1%, a difference of 0.070%), Puget Sound Salish (78.0%, a difference of 0.070%), Pennsylvania German (78.0%, a difference of 0.12%), and Yugoslavian (78.0%, a difference of 0.14%).
| Demographics | Rating | Rank | In Labor Force | Age 20-24 |
| Scandinavians | 100.0 /100 | #13 | Exceptional 78.5% |
| Czechs | 100.0 /100 | #14 | Exceptional 78.5% |
| Sudanese | 100.0 /100 | #15 | Exceptional 78.4% |
| Dutch | 100.0 /100 | #16 | Exceptional 78.4% |
| Cape Verdeans | 100.0 /100 | #17 | Exceptional 78.3% |
| Immigrants | Bosnia and Herzegovina | 100.0 /100 | #18 | Exceptional 78.1% |
| Bangladeshis | 100.0 /100 | #19 | Exceptional 78.1% |
| French Canadians | 100.0 /100 | #20 | Exceptional 78.1% |
| Puget Sound Salish | 100.0 /100 | #21 | Exceptional 78.0% |
| Pennsylvania Germans | 100.0 /100 | #22 | Exceptional 78.0% |
| Yugoslavians | 100.0 /100 | #23 | Exceptional 78.0% |
| Liberians | 100.0 /100 | #24 | Exceptional 78.0% |
| Tlingit-Haida | 100.0 /100 | #25 | Exceptional 77.9% |
| Tongans | 100.0 /100 | #26 | Exceptional 77.9% |
| Immigrants | Micronesia | 100.0 /100 | #27 | Exceptional 77.8% |