African vs Japanese 4th Grade
COMPARE
African
Japanese
4th Grade
4th Grade Comparison
Africans
Japanese
97.4%
4TH GRADE
14.6/ 100
METRIC RATING
204th/ 347
METRIC RANK
96.0%
4TH GRADE
0.0/ 100
METRIC RATING
321st/ 347
METRIC RANK
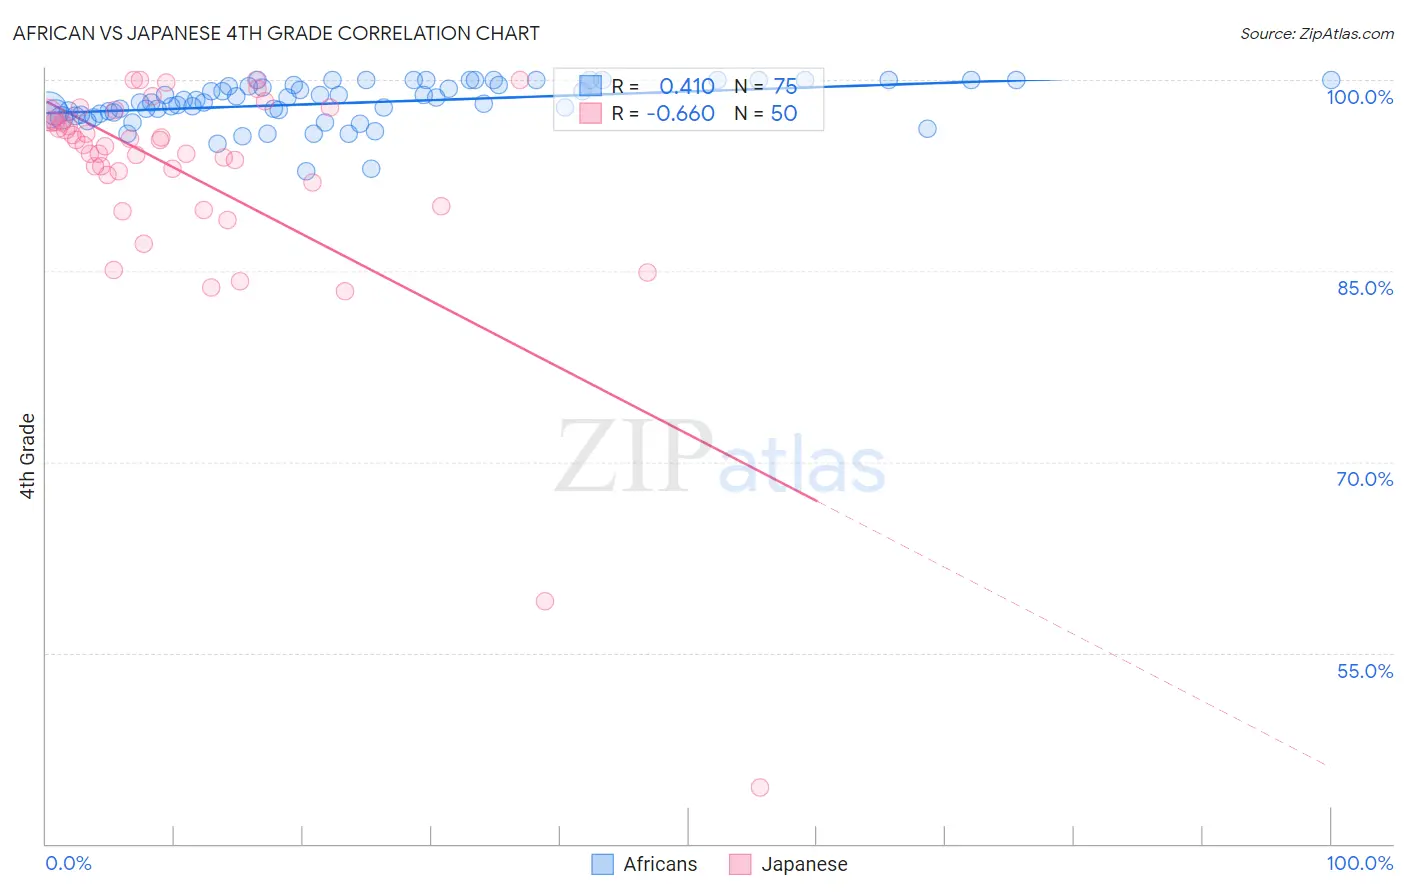
African vs Japanese 4th Grade Correlation Chart
The statistical analysis conducted on geographies consisting of 470,094,744 people shows a moderate positive correlation between the proportion of Africans and percentage of population with at least 4th grade education in the United States with a correlation coefficient (R) of 0.410 and weighted average of 97.4%. Similarly, the statistical analysis conducted on geographies consisting of 249,183,224 people shows a significant negative correlation between the proportion of Japanese and percentage of population with at least 4th grade education in the United States with a correlation coefficient (R) of -0.660 and weighted average of 96.0%, a difference of 1.4%.
4th Grade Correlation Summary
| Measurement | African | Japanese |
| Minimum | 92.9% | 44.4% |
| Maximum | 100.0% | 100.0% |
| Range | 7.1% | 55.6% |
| Mean | 98.2% | 92.4% |
| Median | 98.3% | 94.8% |
| Interquartile 25% (IQ1) | 97.4% | 92.0% |
| Interquartile 75% (IQ3) | 99.6% | 96.7% |
| Interquartile Range (IQR) | 2.2% | 4.8% |
| Standard Deviation (Sample) | 1.6% | 9.6% |
| Standard Deviation (Population) | 1.6% | 9.5% |
Similar Demographics by 4th Grade
Demographics Similar to Africans by 4th Grade
In terms of 4th grade, the demographic groups most similar to Africans are Immigrants from Northern Africa (97.4%, a difference of 0.0%), Immigrants from Southern Europe (97.4%, a difference of 0.010%), Immigrants from Chile (97.4%, a difference of 0.010%), Paiute (97.3%, a difference of 0.010%), and Immigrants from Zaire (97.3%, a difference of 0.010%).
| Demographics | Rating | Rank | 4th Grade |
| Hawaiians | 25.6 /100 | #197 | Fair 97.4% |
| Guamanians/Chamorros | 23.0 /100 | #198 | Fair 97.4% |
| Natives/Alaskans | 20.6 /100 | #199 | Fair 97.4% |
| Immigrants | Uganda | 19.8 /100 | #200 | Poor 97.4% |
| Immigrants | Southern Europe | 16.2 /100 | #201 | Poor 97.4% |
| Immigrants | Chile | 16.1 /100 | #202 | Poor 97.4% |
| Immigrants | Northern Africa | 15.1 /100 | #203 | Poor 97.4% |
| Africans | 14.6 /100 | #204 | Poor 97.4% |
| Paiute | 13.2 /100 | #205 | Poor 97.3% |
| Immigrants | Zaire | 12.8 /100 | #206 | Poor 97.3% |
| Moroccans | 11.3 /100 | #207 | Poor 97.3% |
| Immigrants | Bahamas | 10.8 /100 | #208 | Poor 97.3% |
| Laotians | 9.3 /100 | #209 | Tragic 97.3% |
| Immigrants | Oceania | 9.1 /100 | #210 | Tragic 97.3% |
| Sudanese | 9.0 /100 | #211 | Tragic 97.3% |
Demographics Similar to Japanese by 4th Grade
In terms of 4th grade, the demographic groups most similar to Japanese are Immigrants from Vietnam (96.0%, a difference of 0.0%), Immigrants from Nicaragua (96.0%, a difference of 0.020%), Immigrants from Belize (96.0%, a difference of 0.030%), Dominican (96.0%, a difference of 0.040%), and Hispanic or Latino (96.0%, a difference of 0.050%).
| Demographics | Rating | Rank | 4th Grade |
| Vietnamese | 0.0 /100 | #314 | Tragic 96.2% |
| Nicaraguans | 0.0 /100 | #315 | Tragic 96.2% |
| Immigrants | Ecuador | 0.0 /100 | #316 | Tragic 96.2% |
| Central American Indians | 0.0 /100 | #317 | Tragic 96.2% |
| Immigrants | Azores | 0.0 /100 | #318 | Tragic 96.1% |
| Belizeans | 0.0 /100 | #319 | Tragic 96.1% |
| Bangladeshis | 0.0 /100 | #320 | Tragic 96.1% |
| Japanese | 0.0 /100 | #321 | Tragic 96.0% |
| Immigrants | Vietnam | 0.0 /100 | #322 | Tragic 96.0% |
| Immigrants | Nicaragua | 0.0 /100 | #323 | Tragic 96.0% |
| Immigrants | Belize | 0.0 /100 | #324 | Tragic 96.0% |
| Dominicans | 0.0 /100 | #325 | Tragic 96.0% |
| Hispanics or Latinos | 0.0 /100 | #326 | Tragic 96.0% |
| Hondurans | 0.0 /100 | #327 | Tragic 96.0% |
| Mexican American Indians | 0.0 /100 | #328 | Tragic 95.8% |