African vs Hispanic or Latino In Labor Force | Age 20-24
COMPARE
African
Hispanic or Latino
In Labor Force | Age 20-24
In Labor Force | Age 20-24 Comparison
Africans
Hispanics or Latinos
75.0%
IN LABOR FORCE | AGE 20-24
42.5/ 100
METRIC RATING
181st/ 347
METRIC RANK
74.4%
IN LABOR FORCE | AGE 20-24
7.9/ 100
METRIC RATING
223rd/ 347
METRIC RANK
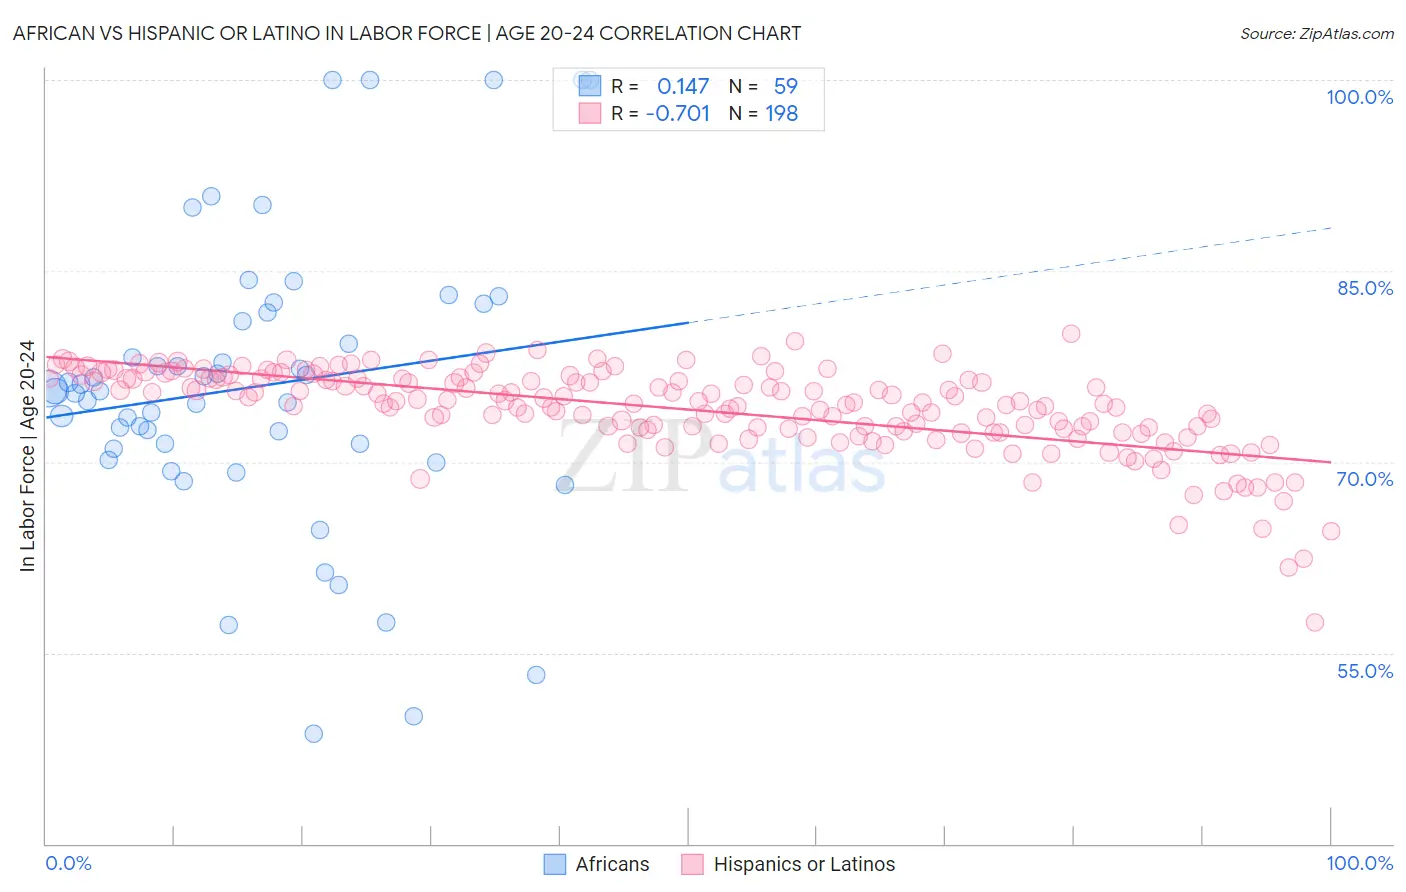
African vs Hispanic or Latino In Labor Force | Age 20-24 Correlation Chart
The statistical analysis conducted on geographies consisting of 469,871,149 people shows a poor positive correlation between the proportion of Africans and labor force participation rate among population between the ages 20 and 24 in the United States with a correlation coefficient (R) of 0.147 and weighted average of 75.0%. Similarly, the statistical analysis conducted on geographies consisting of 573,599,041 people shows a strong negative correlation between the proportion of Hispanics or Latinos and labor force participation rate among population between the ages 20 and 24 in the United States with a correlation coefficient (R) of -0.701 and weighted average of 74.4%, a difference of 0.79%.
In Labor Force | Age 20-24 Correlation Summary
| Measurement | African | Hispanic or Latino |
| Minimum | 48.6% | 57.4% |
| Maximum | 100.0% | 80.0% |
| Range | 51.4% | 22.7% |
| Mean | 75.9% | 74.1% |
| Median | 75.6% | 74.8% |
| Interquartile 25% (IQ1) | 71.0% | 72.6% |
| Interquartile 75% (IQ3) | 81.7% | 76.6% |
| Interquartile Range (IQR) | 10.7% | 4.0% |
| Standard Deviation (Sample) | 11.4% | 3.4% |
| Standard Deviation (Population) | 11.3% | 3.4% |
Similar Demographics by In Labor Force | Age 20-24
Demographics Similar to Africans by In Labor Force | Age 20-24
In terms of in labor force | age 20-24, the demographic groups most similar to Africans are Immigrants from Latvia (75.0%, a difference of 0.020%), Immigrants from Czechoslovakia (75.0%, a difference of 0.020%), Immigrants from Central America (75.0%, a difference of 0.040%), Immigrants from Mexico (75.0%, a difference of 0.080%), and Immigrants from South Africa (74.9%, a difference of 0.080%).
| Demographics | Rating | Rank | In Labor Force | Age 20-24 |
| South Africans | 50.0 /100 | #174 | Average 75.0% |
| Syrians | 49.5 /100 | #175 | Average 75.0% |
| Central Americans | 48.7 /100 | #176 | Average 75.0% |
| Immigrants | Mexico | 47.8 /100 | #177 | Average 75.0% |
| Immigrants | Central America | 45.0 /100 | #178 | Average 75.0% |
| Immigrants | Latvia | 44.1 /100 | #179 | Average 75.0% |
| Immigrants | Czechoslovakia | 44.0 /100 | #180 | Average 75.0% |
| Africans | 42.5 /100 | #181 | Average 75.0% |
| Immigrants | South Africa | 36.9 /100 | #182 | Fair 74.9% |
| Immigrants | Costa Rica | 36.7 /100 | #183 | Fair 74.9% |
| Immigrants | Hungary | 35.0 /100 | #184 | Fair 74.9% |
| Sri Lankans | 34.9 /100 | #185 | Fair 74.9% |
| Immigrants | Eastern Europe | 33.8 /100 | #186 | Fair 74.9% |
| Immigrants | Honduras | 33.5 /100 | #187 | Fair 74.9% |
| Hondurans | 32.7 /100 | #188 | Fair 74.8% |
Demographics Similar to Hispanics or Latinos by In Labor Force | Age 20-24
In terms of in labor force | age 20-24, the demographic groups most similar to Hispanics or Latinos are Seminole (74.3%, a difference of 0.060%), Immigrants from India (74.4%, a difference of 0.090%), Chickasaw (74.5%, a difference of 0.10%), Ghanaian (74.3%, a difference of 0.10%), and Immigrants from Norway (74.5%, a difference of 0.11%).
| Demographics | Rating | Rank | In Labor Force | Age 20-24 |
| Immigrants | Kuwait | 12.7 /100 | #216 | Poor 74.5% |
| Chileans | 12.5 /100 | #217 | Poor 74.5% |
| Immigrants | Peru | 10.6 /100 | #218 | Poor 74.5% |
| Nepalese | 10.5 /100 | #219 | Poor 74.5% |
| Immigrants | Norway | 10.3 /100 | #220 | Poor 74.5% |
| Chickasaw | 10.3 /100 | #221 | Poor 74.5% |
| Immigrants | India | 9.9 /100 | #222 | Tragic 74.4% |
| Hispanics or Latinos | 7.9 /100 | #223 | Tragic 74.4% |
| Seminole | 6.9 /100 | #224 | Tragic 74.3% |
| Ghanaians | 6.2 /100 | #225 | Tragic 74.3% |
| Immigrants | Fiji | 5.9 /100 | #226 | Tragic 74.3% |
| Immigrants | Ireland | 5.8 /100 | #227 | Tragic 74.3% |
| Immigrants | Ukraine | 5.1 /100 | #228 | Tragic 74.2% |
| Immigrants | Sweden | 4.6 /100 | #229 | Tragic 74.2% |
| Immigrants | Albania | 4.3 /100 | #230 | Tragic 74.2% |