Afghan vs Sri Lankan Disability Age 65 to 74
COMPARE
Afghan
Sri Lankan
Disability Age 65 to 74
Disability Age 65 to 74 Comparison
Afghans
Sri Lankans
22.6%
DISABILITY AGE 65 TO 74
88.6/ 100
METRIC RATING
134th/ 347
METRIC RANK
23.0%
DISABILITY AGE 65 TO 74
74.0/ 100
METRIC RATING
154th/ 347
METRIC RANK
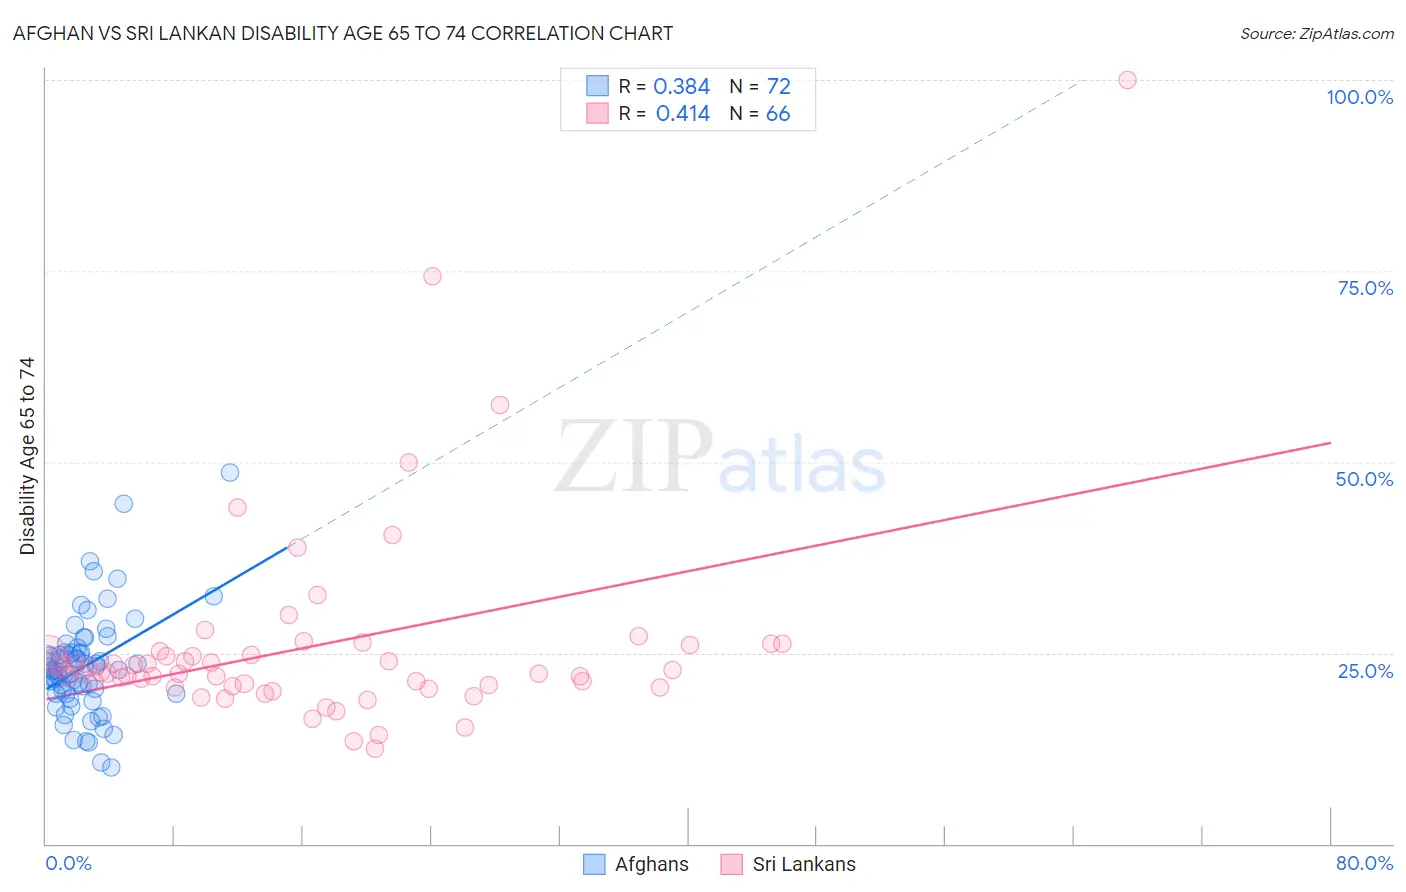
Afghan vs Sri Lankan Disability Age 65 to 74 Correlation Chart
The statistical analysis conducted on geographies consisting of 148,797,358 people shows a mild positive correlation between the proportion of Afghans and percentage of population with a disability between the ages 65 and 75 in the United States with a correlation coefficient (R) of 0.384 and weighted average of 22.6%. Similarly, the statistical analysis conducted on geographies consisting of 439,297,030 people shows a moderate positive correlation between the proportion of Sri Lankans and percentage of population with a disability between the ages 65 and 75 in the United States with a correlation coefficient (R) of 0.414 and weighted average of 23.0%, a difference of 1.5%.
Disability Age 65 to 74 Correlation Summary
| Measurement | Afghan | Sri Lankan |
| Minimum | 10.0% | 12.5% |
| Maximum | 48.7% | 100.0% |
| Range | 38.7% | 87.5% |
| Mean | 23.3% | 25.9% |
| Median | 22.8% | 22.4% |
| Interquartile 25% (IQ1) | 19.7% | 20.6% |
| Interquartile 75% (IQ3) | 25.1% | 25.1% |
| Interquartile Range (IQR) | 5.4% | 4.5% |
| Standard Deviation (Sample) | 6.7% | 13.4% |
| Standard Deviation (Population) | 6.7% | 13.3% |
Demographics Similar to Afghans and Sri Lankans by Disability Age 65 to 74
In terms of disability age 65 to 74, the demographic groups most similar to Afghans are Immigrants from Ukraine (22.6%, a difference of 0.030%), Ethiopian (22.7%, a difference of 0.10%), Taiwanese (22.7%, a difference of 0.14%), Immigrants from Moldova (22.7%, a difference of 0.19%), and Immigrants from Syria (22.7%, a difference of 0.38%). Similarly, the demographic groups most similar to Sri Lankans are Slavic (23.0%, a difference of 0.090%), Finnish (22.9%, a difference of 0.20%), Canadian (22.9%, a difference of 0.29%), Immigrants from Morocco (22.9%, a difference of 0.29%), and Swiss (22.9%, a difference of 0.47%).
| Demographics | Rating | Rank | Disability Age 65 to 74 |
| Afghans | 88.6 /100 | #134 | Excellent 22.6% |
| Immigrants | Ukraine | 88.4 /100 | #135 | Excellent 22.6% |
| Ethiopians | 87.9 /100 | #136 | Excellent 22.7% |
| Taiwanese | 87.6 /100 | #137 | Excellent 22.7% |
| Immigrants | Moldova | 87.3 /100 | #138 | Excellent 22.7% |
| Immigrants | Syria | 85.8 /100 | #139 | Excellent 22.7% |
| Ugandans | 85.4 /100 | #140 | Excellent 22.7% |
| Belgians | 85.3 /100 | #141 | Excellent 22.7% |
| Immigrants | Ethiopia | 85.3 /100 | #142 | Excellent 22.7% |
| Arabs | 84.8 /100 | #143 | Excellent 22.8% |
| Danes | 84.4 /100 | #144 | Excellent 22.8% |
| Immigrants | Uganda | 84.0 /100 | #145 | Excellent 22.8% |
| Alsatians | 83.7 /100 | #146 | Excellent 22.8% |
| Immigrants | Uzbekistan | 83.1 /100 | #147 | Excellent 22.8% |
| New Zealanders | 79.9 /100 | #148 | Good 22.9% |
| Swiss | 79.7 /100 | #149 | Good 22.9% |
| Canadians | 77.7 /100 | #150 | Good 22.9% |
| Immigrants | Morocco | 77.6 /100 | #151 | Good 22.9% |
| Finns | 76.5 /100 | #152 | Good 22.9% |
| Slavs | 75.2 /100 | #153 | Good 23.0% |
| Sri Lankans | 74.0 /100 | #154 | Good 23.0% |