Immigrants from Middle Africa vs Immigrants from Yemen Householder Income Ages 45 - 64 years
COMPARE
Immigrants from Middle Africa
Immigrants from Yemen
Householder Income Ages 45 - 64 years
Householder Income Ages 45 - 64 years Comparison
Immigrants from Middle Africa
Immigrants from Yemen
$91,293
HOUSEHOLDER INCOME AGES 45 - 64 YEARS
1.1/ 100
METRIC RATING
244th/ 347
METRIC RANK
$74,575
HOUSEHOLDER INCOME AGES 45 - 64 YEARS
0.0/ 100
METRIC RATING
340th/ 347
METRIC RANK
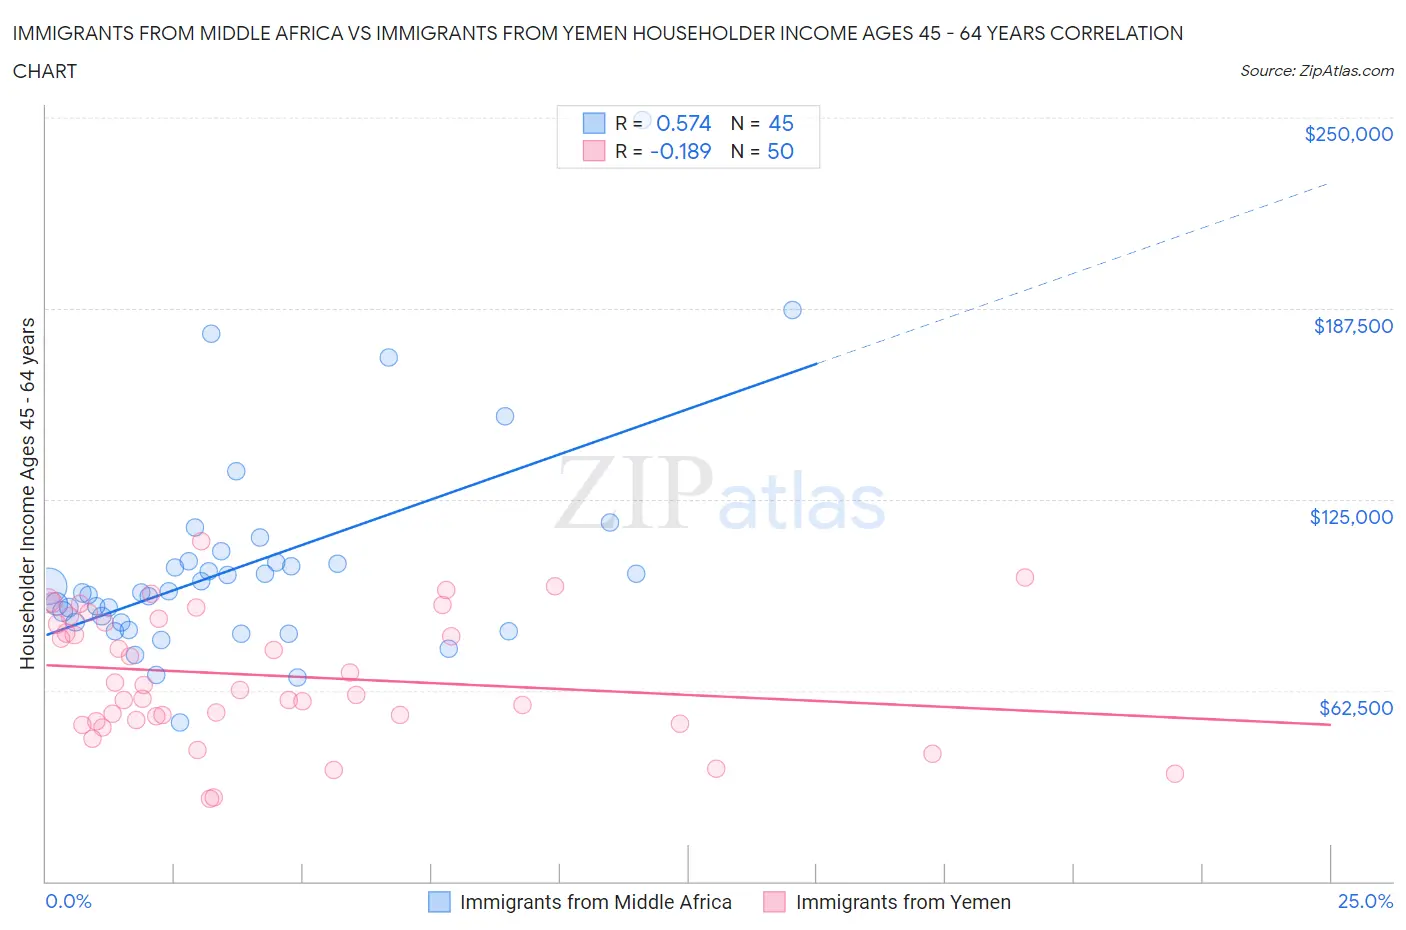
Immigrants from Middle Africa vs Immigrants from Yemen Householder Income Ages 45 - 64 years Correlation Chart
The statistical analysis conducted on geographies consisting of 202,576,362 people shows a substantial positive correlation between the proportion of Immigrants from Middle Africa and household income with householder between the ages 45 and 64 in the United States with a correlation coefficient (R) of 0.574 and weighted average of $91,293. Similarly, the statistical analysis conducted on geographies consisting of 82,418,396 people shows a poor negative correlation between the proportion of Immigrants from Yemen and household income with householder between the ages 45 and 64 in the United States with a correlation coefficient (R) of -0.189 and weighted average of $74,575, a difference of 22.4%.
Householder Income Ages 45 - 64 years Correlation Summary
| Measurement | Immigrants from Middle Africa | Immigrants from Yemen |
| Minimum | $51,937 | $26,815 |
| Maximum | $249,250 | $111,250 |
| Range | $197,313 | $84,435 |
| Mean | $103,154 | $67,361 |
| Median | $94,432 | $63,420 |
| Interquartile 25% (IQ1) | $83,489 | $52,908 |
| Interquartile 75% (IQ3) | $104,529 | $85,795 |
| Interquartile Range (IQR) | $21,040 | $32,887 |
| Standard Deviation (Sample) | $35,287 | $20,711 |
| Standard Deviation (Population) | $34,892 | $20,503 |
Similar Demographics by Householder Income Ages 45 - 64 years
Demographics Similar to Immigrants from Middle Africa by Householder Income Ages 45 - 64 years
In terms of householder income ages 45 - 64 years, the demographic groups most similar to Immigrants from Middle Africa are Immigrants from Trinidad and Tobago ($91,347, a difference of 0.060%), Trinidadian and Tobagonian ($91,357, a difference of 0.070%), Inupiat ($91,355, a difference of 0.070%), Immigrants from Burma/Myanmar ($91,385, a difference of 0.10%), and Immigrants from Ecuador ($91,462, a difference of 0.19%).
| Demographics | Rating | Rank | Householder Income Ages 45 - 64 years |
| Immigrants | Bangladesh | 1.7 /100 | #237 | Tragic $92,208 |
| Pennsylvania Germans | 1.5 /100 | #238 | Tragic $91,956 |
| Immigrants | Ecuador | 1.2 /100 | #239 | Tragic $91,462 |
| Immigrants | Burma/Myanmar | 1.1 /100 | #240 | Tragic $91,385 |
| Trinidadians and Tobagonians | 1.1 /100 | #241 | Tragic $91,357 |
| Inupiat | 1.1 /100 | #242 | Tragic $91,355 |
| Immigrants | Trinidad and Tobago | 1.1 /100 | #243 | Tragic $91,347 |
| Immigrants | Middle Africa | 1.1 /100 | #244 | Tragic $91,293 |
| Guyanese | 0.9 /100 | #245 | Tragic $90,966 |
| Central Americans | 0.9 /100 | #246 | Tragic $90,951 |
| Alaskan Athabascans | 0.9 /100 | #247 | Tragic $90,951 |
| Immigrants | Laos | 0.9 /100 | #248 | Tragic $90,909 |
| Mexican American Indians | 0.8 /100 | #249 | Tragic $90,811 |
| Sub-Saharan Africans | 0.8 /100 | #250 | Tragic $90,691 |
| Americans | 0.7 /100 | #251 | Tragic $90,536 |
Demographics Similar to Immigrants from Yemen by Householder Income Ages 45 - 64 years
In terms of householder income ages 45 - 64 years, the demographic groups most similar to Immigrants from Yemen are Kiowa ($74,815, a difference of 0.32%), Crow ($74,257, a difference of 0.43%), Tohono O'odham ($73,774, a difference of 1.1%), Hopi ($75,562, a difference of 1.3%), and Pueblo ($75,601, a difference of 1.4%).
| Demographics | Rating | Rank | Householder Income Ages 45 - 64 years |
| Immigrants | Congo | 0.0 /100 | #333 | Tragic $77,850 |
| Menominee | 0.0 /100 | #334 | Tragic $76,903 |
| Cheyenne | 0.0 /100 | #335 | Tragic $76,362 |
| Arapaho | 0.0 /100 | #336 | Tragic $75,945 |
| Pueblo | 0.0 /100 | #337 | Tragic $75,601 |
| Hopi | 0.0 /100 | #338 | Tragic $75,562 |
| Kiowa | 0.0 /100 | #339 | Tragic $74,815 |
| Immigrants | Yemen | 0.0 /100 | #340 | Tragic $74,575 |
| Crow | 0.0 /100 | #341 | Tragic $74,257 |
| Tohono O'odham | 0.0 /100 | #342 | Tragic $73,774 |
| Pima | 0.0 /100 | #343 | Tragic $73,365 |
| Houma | 0.0 /100 | #344 | Tragic $72,093 |
| Navajo | 0.0 /100 | #345 | Tragic $69,759 |
| Puerto Ricans | 0.0 /100 | #346 | Tragic $69,234 |
| Lumbee | 0.0 /100 | #347 | Tragic $65,113 |