Zimbabwean vs Carpatho Rusyn Per Capita Income
COMPARE
Zimbabwean
Carpatho Rusyn
Per Capita Income
Per Capita Income Comparison
Zimbabweans
Carpatho Rusyns
$45,804
PER CAPITA INCOME
91.7/ 100
METRIC RATING
125th/ 347
METRIC RANK
$47,248
PER CAPITA INCOME
98.2/ 100
METRIC RATING
97th/ 347
METRIC RANK
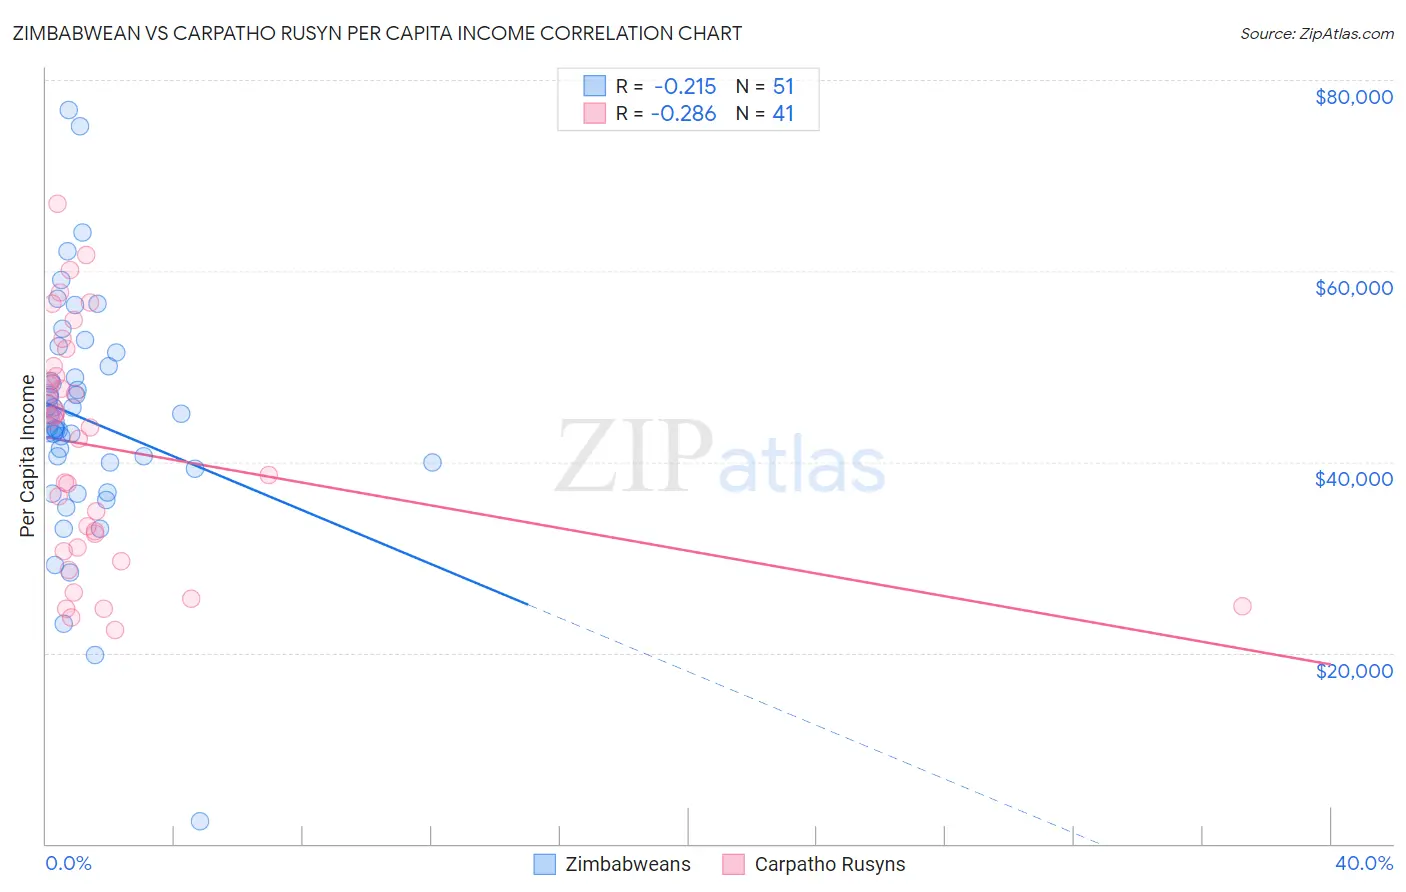
Zimbabwean vs Carpatho Rusyn Per Capita Income Correlation Chart
The statistical analysis conducted on geographies consisting of 69,200,621 people shows a weak negative correlation between the proportion of Zimbabweans and per capita income in the United States with a correlation coefficient (R) of -0.215 and weighted average of $45,804. Similarly, the statistical analysis conducted on geographies consisting of 58,866,831 people shows a weak negative correlation between the proportion of Carpatho Rusyns and per capita income in the United States with a correlation coefficient (R) of -0.286 and weighted average of $47,248, a difference of 3.2%.
Per Capita Income Correlation Summary
| Measurement | Zimbabwean | Carpatho Rusyn |
| Minimum | $2,302 | $22,343 |
| Maximum | $76,842 | $67,093 |
| Range | $74,540 | $44,750 |
| Mean | $44,445 | $41,437 |
| Median | $44,038 | $43,602 |
| Interquartile 25% (IQ1) | $39,330 | $30,789 |
| Interquartile 75% (IQ3) | $50,052 | $49,474 |
| Interquartile Range (IQR) | $10,722 | $18,684 |
| Standard Deviation (Sample) | $12,469 | $12,046 |
| Standard Deviation (Population) | $12,346 | $11,898 |
Similar Demographics by Per Capita Income
Demographics Similar to Zimbabweans by Per Capita Income
In terms of per capita income, the demographic groups most similar to Zimbabweans are Palestinian ($45,790, a difference of 0.030%), European ($45,836, a difference of 0.070%), Lebanese ($45,840, a difference of 0.080%), Moroccan ($45,854, a difference of 0.11%), and Canadian ($45,858, a difference of 0.12%).
| Demographics | Rating | Rank | Per Capita Income |
| Immigrants | Saudi Arabia | 93.3 /100 | #118 | Exceptional $46,008 |
| Immigrants | Poland | 93.1 /100 | #119 | Exceptional $45,979 |
| Immigrants | Ethiopia | 92.7 /100 | #120 | Exceptional $45,923 |
| Canadians | 92.2 /100 | #121 | Exceptional $45,858 |
| Moroccans | 92.1 /100 | #122 | Exceptional $45,854 |
| Lebanese | 92.0 /100 | #123 | Exceptional $45,840 |
| Europeans | 92.0 /100 | #124 | Exceptional $45,836 |
| Zimbabweans | 91.7 /100 | #125 | Exceptional $45,804 |
| Palestinians | 91.6 /100 | #126 | Exceptional $45,790 |
| Immigrants | Germany | 91.3 /100 | #127 | Exceptional $45,751 |
| Swedes | 91.3 /100 | #128 | Exceptional $45,750 |
| Luxembourgers | 90.4 /100 | #129 | Exceptional $45,663 |
| Arabs | 90.4 /100 | #130 | Exceptional $45,662 |
| Immigrants | North Macedonia | 90.0 /100 | #131 | Exceptional $45,622 |
| Jordanians | 89.9 /100 | #132 | Excellent $45,605 |
Demographics Similar to Carpatho Rusyns by Per Capita Income
In terms of per capita income, the demographic groups most similar to Carpatho Rusyns are Alsatian ($47,284, a difference of 0.080%), Immigrants from Egypt ($47,361, a difference of 0.24%), Albanian ($47,379, a difference of 0.28%), Immigrants from Zimbabwe ($47,394, a difference of 0.31%), and Immigrants from Pakistan ($47,084, a difference of 0.35%).
| Demographics | Rating | Rank | Per Capita Income |
| Italians | 98.8 /100 | #90 | Exceptional $47,574 |
| Macedonians | 98.8 /100 | #91 | Exceptional $47,573 |
| Immigrants | Moldova | 98.7 /100 | #92 | Exceptional $47,489 |
| Immigrants | Zimbabwe | 98.5 /100 | #93 | Exceptional $47,394 |
| Albanians | 98.5 /100 | #94 | Exceptional $47,379 |
| Immigrants | Egypt | 98.5 /100 | #95 | Exceptional $47,361 |
| Alsatians | 98.3 /100 | #96 | Exceptional $47,284 |
| Carpatho Rusyns | 98.2 /100 | #97 | Exceptional $47,248 |
| Immigrants | Pakistan | 97.9 /100 | #98 | Exceptional $47,084 |
| Laotians | 97.8 /100 | #99 | Exceptional $47,041 |
| Immigrants | Lebanon | 97.5 /100 | #100 | Exceptional $46,938 |
| Immigrants | Uzbekistan | 97.5 /100 | #101 | Exceptional $46,929 |
| Immigrants | Western Asia | 97.4 /100 | #102 | Exceptional $46,876 |
| Syrians | 97.2 /100 | #103 | Exceptional $46,837 |
| Brazilians | 96.8 /100 | #104 | Exceptional $46,700 |