Zimbabwean vs Carpatho Rusyn Unemployment Among Seniors over 65 years
COMPARE
Zimbabwean
Carpatho Rusyn
Unemployment Among Seniors over 65 years
Unemployment Among Seniors over 65 years Comparison
Zimbabweans
Carpatho Rusyns
5.6%
UNEMPLOYMENT AMONG SENIORS OVER 65 YEARS
0.0/ 100
METRIC RATING
300th/ 347
METRIC RANK
4.9%
UNEMPLOYMENT AMONG SENIORS OVER 65 YEARS
99.8/ 100
METRIC RATING
56th/ 347
METRIC RANK
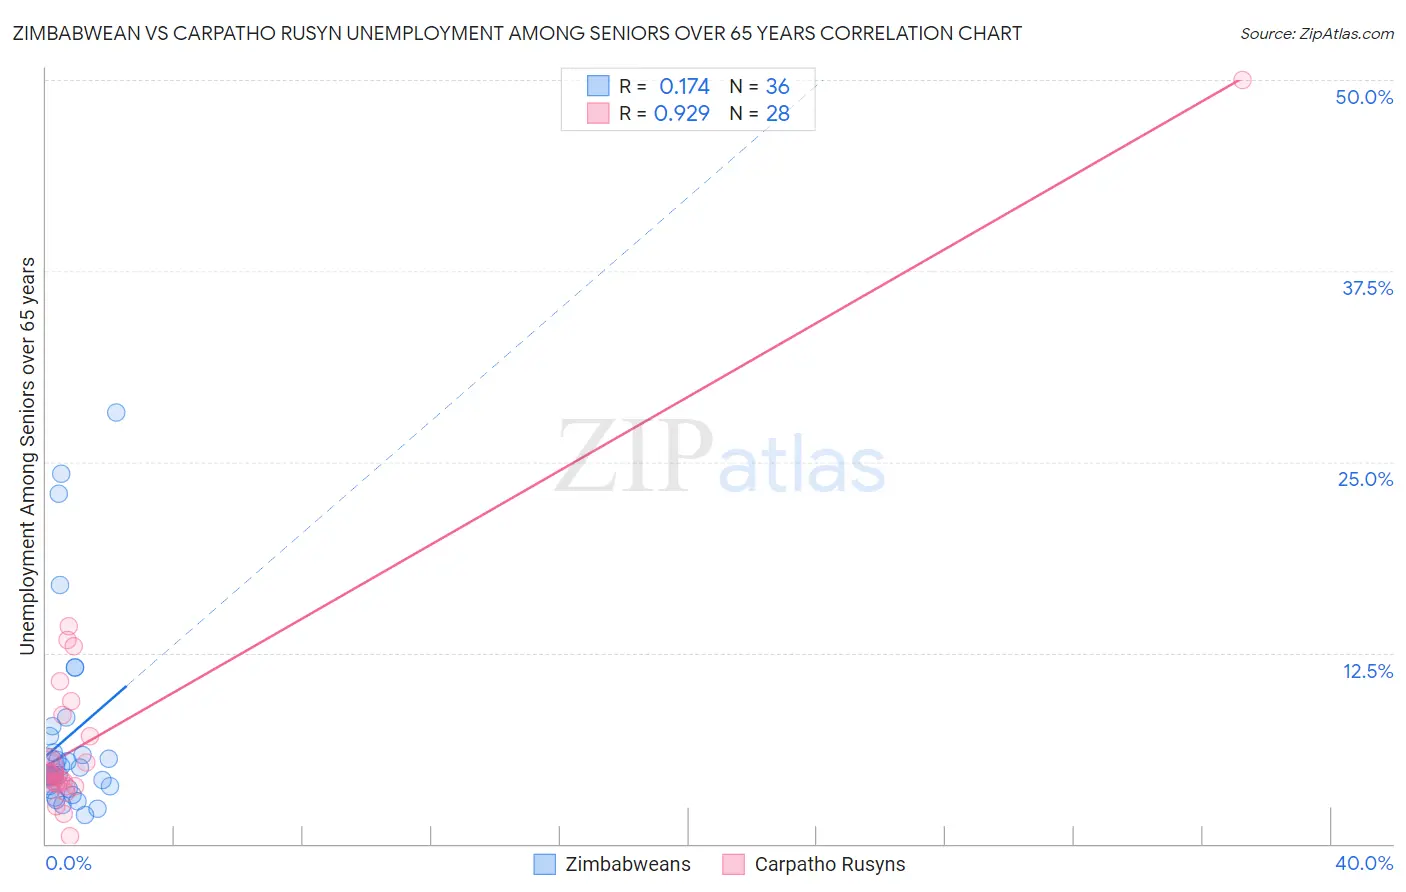
Zimbabwean vs Carpatho Rusyn Unemployment Among Seniors over 65 years Correlation Chart
The statistical analysis conducted on geographies consisting of 67,931,218 people shows a poor positive correlation between the proportion of Zimbabweans and unemployment rate amomg seniors over the age of 65 in the United States with a correlation coefficient (R) of 0.174 and weighted average of 5.6%. Similarly, the statistical analysis conducted on geographies consisting of 57,331,917 people shows a near-perfect positive correlation between the proportion of Carpatho Rusyns and unemployment rate amomg seniors over the age of 65 in the United States with a correlation coefficient (R) of 0.929 and weighted average of 4.9%, a difference of 13.8%.
Unemployment Among Seniors over 65 years Correlation Summary
| Measurement | Zimbabwean | Carpatho Rusyn |
| Minimum | 1.9% | 0.50% |
| Maximum | 28.2% | 50.0% |
| Range | 26.3% | 49.5% |
| Mean | 7.0% | 7.3% |
| Median | 4.5% | 4.5% |
| Interquartile 25% (IQ1) | 3.7% | 3.9% |
| Interquartile 75% (IQ3) | 6.5% | 7.7% |
| Interquartile Range (IQR) | 2.8% | 3.9% |
| Standard Deviation (Sample) | 6.3% | 9.0% |
| Standard Deviation (Population) | 6.2% | 8.9% |
Similar Demographics by Unemployment Among Seniors over 65 years
Demographics Similar to Zimbabweans by Unemployment Among Seniors over 65 years
In terms of unemployment among seniors over 65 years, the demographic groups most similar to Zimbabweans are Guyanese (5.6%, a difference of 0.050%), Immigrants from West Indies (5.6%, a difference of 0.14%), Hispanic or Latino (5.6%, a difference of 0.20%), Yaqui (5.5%, a difference of 0.26%), and Cape Verdean (5.5%, a difference of 0.27%).
| Demographics | Rating | Rank | Unemployment Among Seniors over 65 years |
| Immigrants | Venezuela | 0.0 /100 | #293 | Tragic 5.5% |
| Armenians | 0.0 /100 | #294 | Tragic 5.5% |
| Cheyenne | 0.0 /100 | #295 | Tragic 5.5% |
| Cape Verdeans | 0.0 /100 | #296 | Tragic 5.5% |
| Yaqui | 0.0 /100 | #297 | Tragic 5.5% |
| Immigrants | West Indies | 0.0 /100 | #298 | Tragic 5.6% |
| Guyanese | 0.0 /100 | #299 | Tragic 5.6% |
| Zimbabweans | 0.0 /100 | #300 | Tragic 5.6% |
| Hispanics or Latinos | 0.0 /100 | #301 | Tragic 5.6% |
| Guatemalans | 0.0 /100 | #302 | Tragic 5.6% |
| Immigrants | Latin America | 0.0 /100 | #303 | Tragic 5.6% |
| Liberians | 0.0 /100 | #304 | Tragic 5.6% |
| Mexicans | 0.0 /100 | #305 | Tragic 5.6% |
| Ecuadorians | 0.0 /100 | #306 | Tragic 5.6% |
| Portuguese | 0.0 /100 | #307 | Tragic 5.6% |
Demographics Similar to Carpatho Rusyns by Unemployment Among Seniors over 65 years
In terms of unemployment among seniors over 65 years, the demographic groups most similar to Carpatho Rusyns are Danish (4.9%, a difference of 0.050%), European (4.9%, a difference of 0.060%), Scandinavian (4.9%, a difference of 0.060%), Immigrants from Iraq (4.9%, a difference of 0.070%), and Immigrants from Sudan (4.9%, a difference of 0.13%).
| Demographics | Rating | Rank | Unemployment Among Seniors over 65 years |
| Immigrants | Kenya | 99.9 /100 | #49 | Exceptional 4.9% |
| Immigrants | Austria | 99.9 /100 | #50 | Exceptional 4.9% |
| Scotch-Irish | 99.9 /100 | #51 | Exceptional 4.9% |
| Swedes | 99.9 /100 | #52 | Exceptional 4.9% |
| Immigrants | Sudan | 99.8 /100 | #53 | Exceptional 4.9% |
| Immigrants | Iraq | 99.8 /100 | #54 | Exceptional 4.9% |
| Europeans | 99.8 /100 | #55 | Exceptional 4.9% |
| Carpatho Rusyns | 99.8 /100 | #56 | Exceptional 4.9% |
| Danes | 99.8 /100 | #57 | Exceptional 4.9% |
| Scandinavians | 99.8 /100 | #58 | Exceptional 4.9% |
| Immigrants | Eastern Africa | 99.7 /100 | #59 | Exceptional 4.9% |
| Immigrants | Middle Africa | 99.7 /100 | #60 | Exceptional 4.9% |
| Northern Europeans | 99.7 /100 | #61 | Exceptional 4.9% |
| Latvians | 99.6 /100 | #62 | Exceptional 4.9% |
| Croatians | 99.6 /100 | #63 | Exceptional 4.9% |