Immigrants from Burma/Myanmar vs Carpatho Rusyn Per Capita Income
COMPARE
Immigrants from Burma/Myanmar
Carpatho Rusyn
Per Capita Income
Per Capita Income Comparison
Immigrants from Burma/Myanmar
Carpatho Rusyns
$39,827
PER CAPITA INCOME
1.3/ 100
METRIC RATING
250th/ 347
METRIC RANK
$47,248
PER CAPITA INCOME
98.2/ 100
METRIC RATING
97th/ 347
METRIC RANK
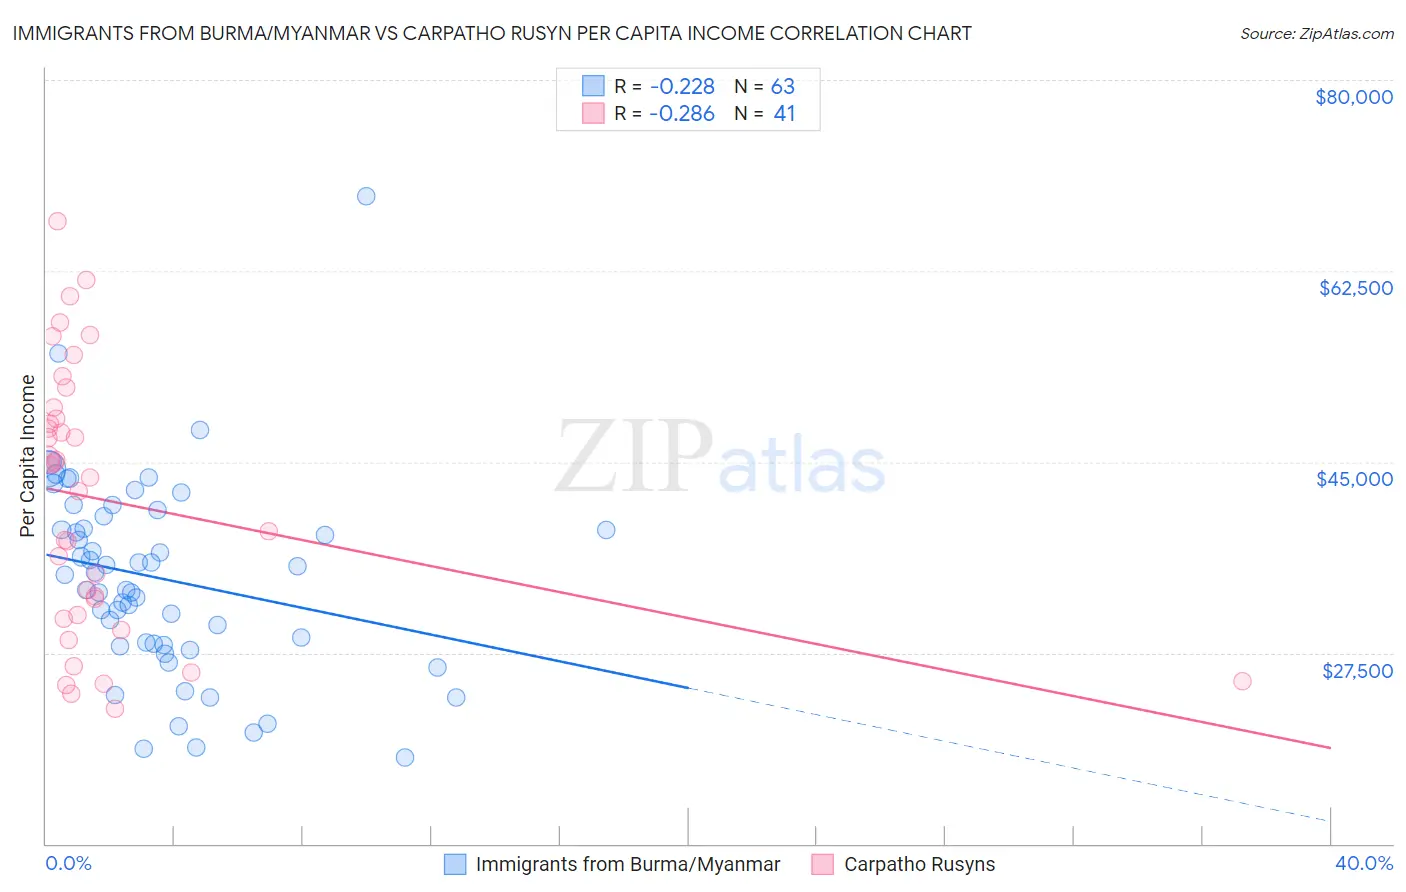
Immigrants from Burma/Myanmar vs Carpatho Rusyn Per Capita Income Correlation Chart
The statistical analysis conducted on geographies consisting of 172,363,704 people shows a weak negative correlation between the proportion of Immigrants from Burma/Myanmar and per capita income in the United States with a correlation coefficient (R) of -0.228 and weighted average of $39,827. Similarly, the statistical analysis conducted on geographies consisting of 58,866,831 people shows a weak negative correlation between the proportion of Carpatho Rusyns and per capita income in the United States with a correlation coefficient (R) of -0.286 and weighted average of $47,248, a difference of 18.6%.
Per Capita Income Correlation Summary
| Measurement | Immigrants from Burma/Myanmar | Carpatho Rusyn |
| Minimum | $17,897 | $22,343 |
| Maximum | $69,358 | $67,093 |
| Range | $51,461 | $44,750 |
| Mean | $34,299 | $41,437 |
| Median | $34,636 | $43,602 |
| Interquartile 25% (IQ1) | $28,210 | $30,789 |
| Interquartile 75% (IQ3) | $40,057 | $49,474 |
| Interquartile Range (IQR) | $11,847 | $18,684 |
| Standard Deviation (Sample) | $9,103 | $12,046 |
| Standard Deviation (Population) | $9,031 | $11,898 |
Similar Demographics by Per Capita Income
Demographics Similar to Immigrants from Burma/Myanmar by Per Capita Income
In terms of per capita income, the demographic groups most similar to Immigrants from Burma/Myanmar are Samoan ($39,826, a difference of 0.0%), Japanese ($39,870, a difference of 0.11%), Cape Verdean ($39,935, a difference of 0.27%), Immigrants from Somalia ($39,974, a difference of 0.37%), and Immigrants from the Azores ($39,608, a difference of 0.55%).
| Demographics | Rating | Rank | Per Capita Income |
| German Russians | 2.2 /100 | #243 | Tragic $40,266 |
| French American Indians | 2.1 /100 | #244 | Tragic $40,244 |
| Sub-Saharan Africans | 1.9 /100 | #245 | Tragic $40,152 |
| Cree | 1.7 /100 | #246 | Tragic $40,056 |
| Immigrants | Somalia | 1.6 /100 | #247 | Tragic $39,974 |
| Cape Verdeans | 1.5 /100 | #248 | Tragic $39,935 |
| Japanese | 1.4 /100 | #249 | Tragic $39,870 |
| Immigrants | Burma/Myanmar | 1.3 /100 | #250 | Tragic $39,827 |
| Samoans | 1.3 /100 | #251 | Tragic $39,826 |
| Immigrants | Azores | 1.0 /100 | #252 | Tragic $39,608 |
| Osage | 1.0 /100 | #253 | Tragic $39,568 |
| Alaska Natives | 1.0 /100 | #254 | Tragic $39,558 |
| Immigrants | Middle Africa | 1.0 /100 | #255 | Tragic $39,529 |
| Hawaiians | 0.8 /100 | #256 | Tragic $39,403 |
| Nicaraguans | 0.8 /100 | #257 | Tragic $39,372 |
Demographics Similar to Carpatho Rusyns by Per Capita Income
In terms of per capita income, the demographic groups most similar to Carpatho Rusyns are Alsatian ($47,284, a difference of 0.080%), Immigrants from Egypt ($47,361, a difference of 0.24%), Albanian ($47,379, a difference of 0.28%), Immigrants from Zimbabwe ($47,394, a difference of 0.31%), and Immigrants from Pakistan ($47,084, a difference of 0.35%).
| Demographics | Rating | Rank | Per Capita Income |
| Italians | 98.8 /100 | #90 | Exceptional $47,574 |
| Macedonians | 98.8 /100 | #91 | Exceptional $47,573 |
| Immigrants | Moldova | 98.7 /100 | #92 | Exceptional $47,489 |
| Immigrants | Zimbabwe | 98.5 /100 | #93 | Exceptional $47,394 |
| Albanians | 98.5 /100 | #94 | Exceptional $47,379 |
| Immigrants | Egypt | 98.5 /100 | #95 | Exceptional $47,361 |
| Alsatians | 98.3 /100 | #96 | Exceptional $47,284 |
| Carpatho Rusyns | 98.2 /100 | #97 | Exceptional $47,248 |
| Immigrants | Pakistan | 97.9 /100 | #98 | Exceptional $47,084 |
| Laotians | 97.8 /100 | #99 | Exceptional $47,041 |
| Immigrants | Lebanon | 97.5 /100 | #100 | Exceptional $46,938 |
| Immigrants | Uzbekistan | 97.5 /100 | #101 | Exceptional $46,929 |
| Immigrants | Western Asia | 97.4 /100 | #102 | Exceptional $46,876 |
| Syrians | 97.2 /100 | #103 | Exceptional $46,837 |
| Brazilians | 96.8 /100 | #104 | Exceptional $46,700 |