Immigrants from Chile vs Carpatho Rusyn Per Capita Income
COMPARE
Immigrants from Chile
Carpatho Rusyn
Per Capita Income
Per Capita Income Comparison
Immigrants from Chile
Carpatho Rusyns
$46,213
PER CAPITA INCOME
94.6/ 100
METRIC RATING
115th/ 347
METRIC RANK
$47,248
PER CAPITA INCOME
98.2/ 100
METRIC RATING
97th/ 347
METRIC RANK
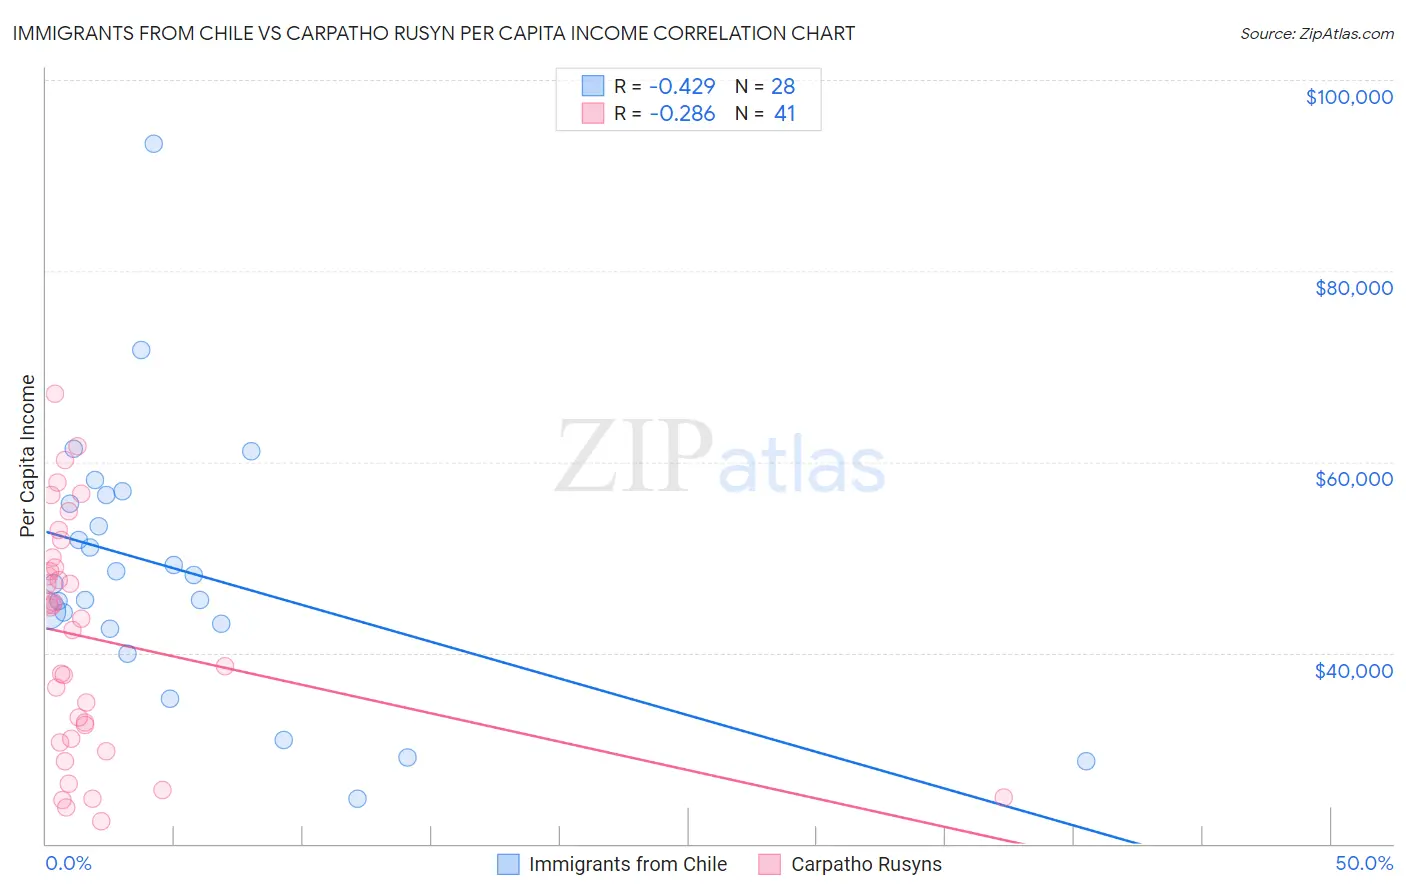
Immigrants from Chile vs Carpatho Rusyn Per Capita Income Correlation Chart
The statistical analysis conducted on geographies consisting of 218,646,729 people shows a moderate negative correlation between the proportion of Immigrants from Chile and per capita income in the United States with a correlation coefficient (R) of -0.429 and weighted average of $46,213. Similarly, the statistical analysis conducted on geographies consisting of 58,866,831 people shows a weak negative correlation between the proportion of Carpatho Rusyns and per capita income in the United States with a correlation coefficient (R) of -0.286 and weighted average of $47,248, a difference of 2.2%.
Per Capita Income Correlation Summary
| Measurement | Immigrants from Chile | Carpatho Rusyn |
| Minimum | $24,660 | $22,343 |
| Maximum | $93,304 | $67,093 |
| Range | $68,644 | $44,750 |
| Mean | $48,666 | $41,437 |
| Median | $47,656 | $43,602 |
| Interquartile 25% (IQ1) | $42,721 | $30,789 |
| Interquartile 75% (IQ3) | $56,086 | $49,474 |
| Interquartile Range (IQR) | $13,365 | $18,684 |
| Standard Deviation (Sample) | $13,904 | $12,046 |
| Standard Deviation (Population) | $13,654 | $11,898 |
Demographics Similar to Immigrants from Chile and Carpatho Rusyns by Per Capita Income
In terms of per capita income, the demographic groups most similar to Immigrants from Chile are Afghan ($46,268, a difference of 0.12%), Polish ($46,123, a difference of 0.20%), Immigrants from Albania ($46,387, a difference of 0.38%), Immigrants from Morocco ($46,430, a difference of 0.47%), and Taiwanese ($46,455, a difference of 0.52%). Similarly, the demographic groups most similar to Carpatho Rusyns are Alsatian ($47,284, a difference of 0.080%), Immigrants from Pakistan ($47,084, a difference of 0.35%), Laotian ($47,041, a difference of 0.44%), Immigrants from Lebanon ($46,938, a difference of 0.66%), and Immigrants from Uzbekistan ($46,929, a difference of 0.68%).
| Demographics | Rating | Rank | Per Capita Income |
| Alsatians | 98.3 /100 | #96 | Exceptional $47,284 |
| Carpatho Rusyns | 98.2 /100 | #97 | Exceptional $47,248 |
| Immigrants | Pakistan | 97.9 /100 | #98 | Exceptional $47,084 |
| Laotians | 97.8 /100 | #99 | Exceptional $47,041 |
| Immigrants | Lebanon | 97.5 /100 | #100 | Exceptional $46,938 |
| Immigrants | Uzbekistan | 97.5 /100 | #101 | Exceptional $46,929 |
| Immigrants | Western Asia | 97.4 /100 | #102 | Exceptional $46,876 |
| Syrians | 97.2 /100 | #103 | Exceptional $46,837 |
| Brazilians | 96.8 /100 | #104 | Exceptional $46,700 |
| British | 96.3 /100 | #105 | Exceptional $46,571 |
| Ethiopians | 96.3 /100 | #106 | Exceptional $46,569 |
| Serbians | 96.2 /100 | #107 | Exceptional $46,551 |
| Immigrants | Kuwait | 96.2 /100 | #108 | Exceptional $46,543 |
| Immigrants | Northern Africa | 96.2 /100 | #109 | Exceptional $46,531 |
| Chileans | 95.9 /100 | #110 | Exceptional $46,459 |
| Taiwanese | 95.8 /100 | #111 | Exceptional $46,455 |
| Immigrants | Morocco | 95.7 /100 | #112 | Exceptional $46,430 |
| Immigrants | Albania | 95.5 /100 | #113 | Exceptional $46,387 |
| Afghans | 94.9 /100 | #114 | Exceptional $46,268 |
| Immigrants | Chile | 94.6 /100 | #115 | Exceptional $46,213 |
| Poles | 94.1 /100 | #116 | Exceptional $46,123 |