Zimbabwean vs Guamanian/Chamorro Per Capita Income

COMPARE

Zimbabwean
Race
Ancestry
AfghanAfricanAlaska NativeAlaskan AthabascanAlbanianAleutAlsatianAmericanApacheArabArapahoArgentineanArmenianAssyrian/Chaldean/SyriacAustralianAustrianBahamianBangladeshiBarbadianBasqueBelgianBelizeanBermudanBhutaneseBlackfeetBolivianBrazilianBritishBritish West IndianBulgarianBurmeseCajunCambodianCanadianCape VerdeanCarpatho RusynCelticCentral AmericanCentral American IndianCherokeeCheyenneChickasawChileanChineseChippewaChoctawColombianColvilleComancheCosta RicanCreeCreekCroatianCrowCubanCypriotCzechCzechoslovakianDanishDelawareDominicanDutchDutch West IndianEastern EuropeanEcuadorianEgyptianEnglishEstonianEthiopianEuropeanFijianFilipinoFinnishFrenchFrench American IndianFrench CanadianGermanGerman RussianGhanaianGreekGuatemalanGuyaneseHaitianHmongHonduranHopiHoumaHungarianIcelanderIndian (Asian)IndonesianInupiatIranianIraqiIrishIroquoisIsraeliItalianJamaicanJapaneseJordanianKenyanKiowaKoreanLaotianLatvianLebaneseLiberianLithuanianLumbeeLuxembourgerMacedonianMalaysianMalteseMarshalleseMenomineeMexicanMexican American IndianMongolianMoroccanNative HawaiianNavajoNepaleseNew ZealanderNicaraguanNigerianNorthern EuropeanNorwegianOkinawanOsageOttawaPaiutePakistaniPalestinianPanamanianParaguayanPennsylvania GermanPeruvianPimaPolishPortuguesePotawatomiPuebloPuerto RicanPuget Sound SalishRomanianRussianSalvadoranSamoanScandinavianScotch-IrishScottishSeminoleSenegaleseSerbianShoshoneSierra LeoneanSiouxSlavicSlovakSloveneSomaliSouth AfricanSouth AmericanSouth American IndianSoviet UnionSpaniardSpanishSpanish AmericanSpanish American IndianSri LankanSubsaharan AfricanSudaneseSwedishSwissSyrianTaiwaneseThaiTlingit-HaidaTohono O'OdhamTonganTrinidadian and TobagonianTsimshianTurkishU.S. Virgin IslanderUgandanUkrainianUruguayanUteVenezuelanVietnameseWelshWest IndianYakamaYaquiYugoslavianYumanYup'ikZimbabwean
Immigration
NonimmigrantsImmigrantsAfghanistanAfricaAlbaniaArgentinaArmeniaAsiaAustraliaAustriaBahamasBangladeshBarbadosBelarusBelgiumBelizeBoliviaBosnia and HerzegovinaBrazilBulgariaBurma/MyanmarCabo VerdeCambodiaCameroonCanadaCaribbeanCentral AmericaChileChinaColombiaCongoCosta RicaCroatiaCubaCzechoslovakiaDenmarkDominicaDominican RepublicEastern AfricaEastern AsiaEastern EuropeEcuadorEgyptEl SalvadorEnglandEritreaEthiopiaEuropeFijiFranceGermanyGhanaGreeceGrenadaGuatemalaGuyanaHaitiHondurasHong KongHungaryIndiaIndonesiaIranIraqIrelandIsraelItalyJamaicaJapanJordanKazakhstanKenyaKoreaKuwaitLaosLatin AmericaLatviaLebanonLiberiaLithuaniaMalaysiaMexicoMicronesiaMiddle AfricaMoldovaMoroccoNepalNetherlandsNicaraguaNigeriaNorth AmericaNorth MacedoniaNorthern AfricaNorthern EuropeNorwayOceaniaPakistanPanamaPeruPhilippinesPolandPortugalRomaniaRussiaSaudi ArabiaScotlandSenegalSerbiaSierra LeoneSingaporeSomaliaSouth AfricaSouth AmericaSouth Central AsiaSouth Eastern AsiaSouthern EuropeSpainSri LankaSt. Vincent and the GrenadinesSudanSwedenSwitzerlandSyriaTaiwanThailandTrinidad and TobagoTurkeyUgandaUkraineUruguayUzbekistanVenezuelaVietnamWest IndiesWestern AfricaWestern AsiaWestern EuropeYemenZaireZimbabweAzores
Guamanian/Chamorro
Race
Ancestry
AfghanAfricanAlaska NativeAlaskan AthabascanAlbanianAleutAlsatianAmericanApacheArabArapahoArgentineanArmenianAssyrian/Chaldean/SyriacAustralianAustrianBahamianBangladeshiBarbadianBasqueBelgianBelizeanBermudanBhutaneseBlackfeetBolivianBrazilianBritishBritish West IndianBulgarianBurmeseCajunCambodianCanadianCape VerdeanCarpatho RusynCelticCentral AmericanCentral American IndianCherokeeCheyenneChickasawChileanChineseChippewaChoctawColombianColvilleComancheCosta RicanCreeCreekCroatianCrowCubanCypriotCzechCzechoslovakianDanishDelawareDominicanDutchDutch West IndianEastern EuropeanEcuadorianEgyptianEnglishEstonianEthiopianEuropeanFijianFilipinoFinnishFrenchFrench American IndianFrench CanadianGermanGerman RussianGhanaianGreekGuamanian/ChamorroGuatemalanGuyaneseHaitianHmongHonduranHopiHoumaHungarianIcelanderIndian (Asian)IndonesianInupiatIranianIraqiIrishIroquoisIsraeliItalianJamaicanJapaneseJordanianKenyanKiowaKoreanLaotianLatvianLebaneseLiberianLithuanianLumbeeLuxembourgerMacedonianMalaysianMalteseMarshalleseMenomineeMexicanMexican American IndianMongolianMoroccanNative HawaiianNavajoNepaleseNew ZealanderNicaraguanNigerianNorthern EuropeanNorwegianOkinawanOsageOttawaPaiutePakistaniPalestinianPanamanianParaguayanPennsylvania GermanPeruvianPimaPolishPortuguesePotawatomiPuebloPuerto RicanPuget Sound SalishRomanianRussianSalvadoranSamoanScandinavianScotch-IrishScottishSeminoleSenegaleseSerbianShoshoneSierra LeoneanSiouxSlavicSlovakSloveneSomaliSouth AfricanSouth AmericanSouth American IndianSoviet UnionSpaniardSpanishSpanish AmericanSpanish American IndianSri LankanSubsaharan AfricanSudaneseSwedishSwissSyrianTaiwaneseThaiTlingit-HaidaTohono O'OdhamTonganTrinidadian and TobagonianTsimshianTurkishU.S. Virgin IslanderUgandanUkrainianUruguayanUteVenezuelanVietnameseWelshWest IndianYakamaYaquiYugoslavianYumanYup'ik
Immigration
NonimmigrantsImmigrantsAfghanistanAfricaAlbaniaArgentinaArmeniaAsiaAustraliaAustriaBahamasBangladeshBarbadosBelarusBelgiumBelizeBoliviaBosnia and HerzegovinaBrazilBulgariaBurma/MyanmarCabo VerdeCambodiaCameroonCanadaCaribbeanCentral AmericaChileChinaColombiaCongoCosta RicaCroatiaCubaCzechoslovakiaDenmarkDominicaDominican RepublicEastern AfricaEastern AsiaEastern EuropeEcuadorEgyptEl SalvadorEnglandEritreaEthiopiaEuropeFijiFranceGermanyGhanaGreeceGrenadaGuatemalaGuyanaHaitiHondurasHong KongHungaryIndiaIndonesiaIranIraqIrelandIsraelItalyJamaicaJapanJordanKazakhstanKenyaKoreaKuwaitLaosLatin AmericaLatviaLebanonLiberiaLithuaniaMalaysiaMexicoMicronesiaMiddle AfricaMoldovaMoroccoNepalNetherlandsNicaraguaNigeriaNorth AmericaNorth MacedoniaNorthern AfricaNorthern EuropeNorwayOceaniaPakistanPanamaPeruPhilippinesPolandPortugalRomaniaRussiaSaudi ArabiaScotlandSenegalSerbiaSierra LeoneSingaporeSomaliaSouth AfricaSouth AmericaSouth Central AsiaSouth Eastern AsiaSouthern EuropeSpainSri LankaSt. Vincent and the GrenadinesSudanSwedenSwitzerlandSyriaTaiwanThailandTrinidad and TobagoTurkeyUgandaUkraineUruguayUzbekistanVenezuelaVietnamWest IndiesWestern AfricaWestern AsiaWestern EuropeYemenZaireZimbabweAzores
Per Capita Income
Income
Poverty
Unemployment
Labor Participation
Family Structure
Vehicle Availability
Education Level
Disability

Per Capita Income Comparison

Zimbabweans

Guamanians/Chamorros

Exceptional
Tragic
$45,804
PER CAPITA INCOME
91.7/ 100
METRIC RATING
125th/ 347
METRIC RANK
$41,678
PER CAPITA INCOME
9.7/ 100
METRIC RATING
217th/ 347
METRIC RANK

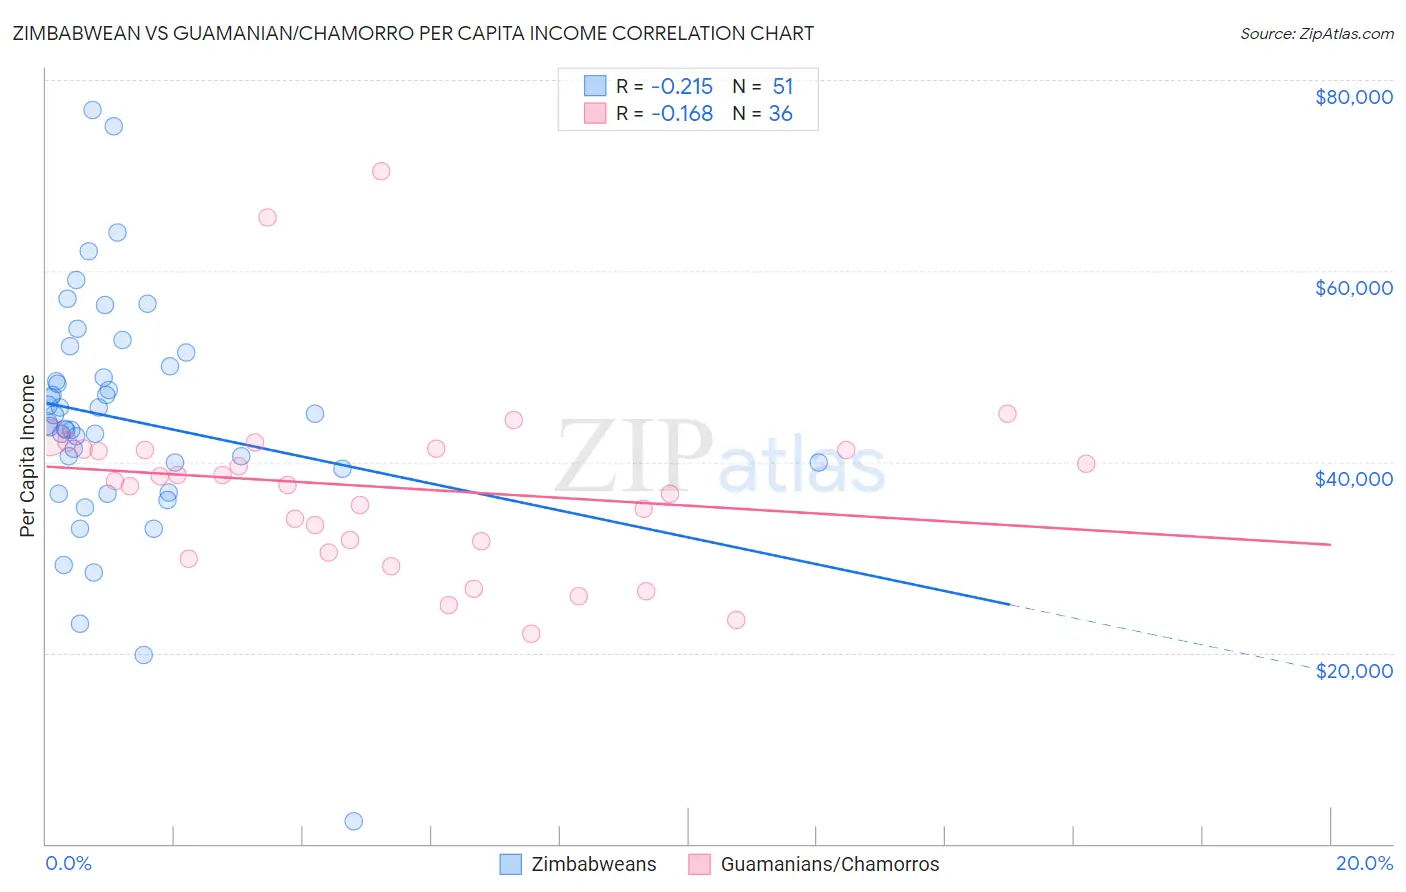
Zimbabwean vs Guamanian/Chamorro Per Capita Income Correlation Chart

The statistical analysis conducted on geographies consisting of 69,200,621 people shows a weak negative correlation between the proportion of Zimbabweans and per capita income in the United States with a correlation coefficient (R) of -0.215 and weighted average of $45,804. Similarly, the statistical analysis conducted on geographies consisting of 221,916,418 people shows a poor negative correlation between the proportion of Guamanians/Chamorros and per capita income in the United States with a correlation coefficient (R) of -0.168 and weighted average of $41,678, a difference of 9.9%.
Zimbabwean vs Guamanian/Chamorro Per Capita Income

Per Capita Income Correlation Summary

MeasurementZimbabweanGuamanian/Chamorro
Minimum$2,302$21,937
Maximum$76,842$70,391
Range$74,540$48,454
Mean$44,445$37,325
Median$44,038$37,776
Interquartile 25% (IQ1)$39,330$31,068
Interquartile 75% (IQ3)$50,052$41,275
Interquartile Range (IQR)$10,722$10,207
Standard Deviation (Sample)$12,469$9,827
Standard Deviation (Population)$12,346$9,689

Similar Demographics by Per Capita Income

Demographics Similar to Zimbabweans by Per Capita Income

In terms of per capita income, the demographic groups most similar to Zimbabweans are Palestinian ($45,790, a difference of 0.030%), European ($45,836, a difference of 0.070%), Lebanese ($45,840, a difference of 0.080%), Moroccan ($45,854, a difference of 0.11%), and Canadian ($45,858, a difference of 0.12%).
DemographicsRating | RankPer Capita Income
Immigrants | Saudi Arabia
93.3
/100
|
#118
Exceptional
$46,008
Immigrants | Poland
93.1
/100
|
#119
Exceptional
$45,979
Immigrants | Ethiopia
92.7
/100
|
#120
Exceptional
$45,923
Canadians
92.2
/100
|
#121
Exceptional
$45,858
Moroccans
92.1
/100
|
#122
Exceptional
$45,854
Lebanese
92.0
/100
|
#123
Exceptional
$45,840
Europeans
92.0
/100
|
#124
Exceptional
$45,836
Zimbabweans
91.7
/100
|
#125
Exceptional
$45,804
Palestinians
91.6
/100
|
#126
Exceptional
$45,790
Immigrants | Germany
91.3
/100
|
#127
Exceptional
$45,751
Swedes
91.3
/100
|
#128
Exceptional
$45,750
Luxembourgers
90.4
/100
|
#129
Exceptional
$45,663
Arabs
90.4
/100
|
#130
Exceptional
$45,662
Immigrants | North Macedonia
90.0
/100
|
#131
Exceptional
$45,622
Jordanians
89.9
/100
|
#132
Excellent
$45,605

Demographics Similar to Guamanians/Chamorros by Per Capita Income

In terms of per capita income, the demographic groups most similar to Guamanians/Chamorros are Tongan ($41,693, a difference of 0.030%), Sudanese ($41,695, a difference of 0.040%), Trinidadian and Tobagonian ($41,655, a difference of 0.060%), Immigrants from Bangladesh ($41,709, a difference of 0.070%), and Immigrants from Venezuela ($41,727, a difference of 0.12%).
DemographicsRating | RankPer Capita Income
Ecuadorians
12.9
/100
|
#210
Poor
$41,958
Immigrants | Panama
11.6
/100
|
#211
Poor
$41,853
Immigrants | Senegal
11.3
/100
|
#212
Poor
$41,830
Immigrants | Venezuela
10.2
/100
|
#213
Poor
$41,727
Immigrants | Bangladesh
10.1
/100
|
#214
Poor
$41,709
Sudanese
9.9
/100
|
#215
Tragic
$41,695
Tongans
9.9
/100
|
#216
Tragic
$41,693
Guamanians/Chamorros
9.7
/100
|
#217
Tragic
$41,678
Trinidadians and Tobagonians
9.5
/100
|
#218
Tragic
$41,655
Puget Sound Salish
8.1
/100
|
#219
Tragic
$41,495
Immigrants | Barbados
7.9
/100
|
#220
Tragic
$41,478
Immigrants | Trinidad and Tobago
7.9
/100
|
#221
Tragic
$41,476
Immigrants | Iraq
7.1
/100
|
#222
Tragic
$41,365
Immigrants | Cameroon
6.8
/100
|
#223
Tragic
$41,334
Immigrants | St. Vincent and the Grenadines
6.4
/100
|
#224
Tragic
$41,270