Zimbabwean vs Arapaho Householder Income Ages 25 - 44 years
COMPARE
Zimbabwean
Arapaho
Householder Income Ages 25 - 44 years
Householder Income Ages 25 - 44 years Comparison
Zimbabweans
Arapaho
$98,586
HOUSEHOLDER INCOME AGES 25 - 44 YEARS
90.3/ 100
METRIC RATING
124th/ 347
METRIC RANK
$71,697
HOUSEHOLDER INCOME AGES 25 - 44 YEARS
0.0/ 100
METRIC RATING
341st/ 347
METRIC RANK
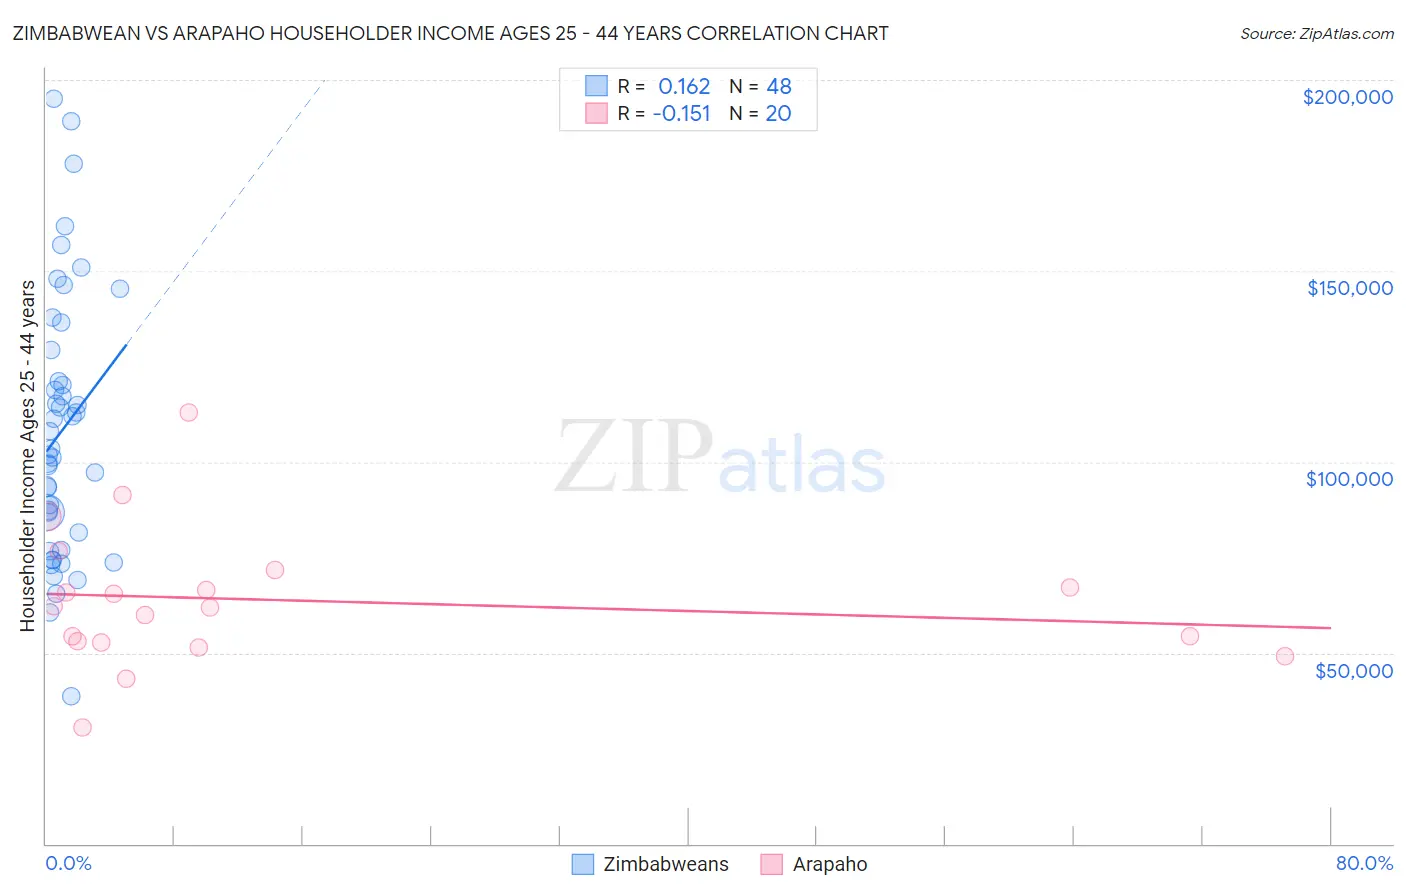
Zimbabwean vs Arapaho Householder Income Ages 25 - 44 years Correlation Chart
The statistical analysis conducted on geographies consisting of 69,182,537 people shows a poor positive correlation between the proportion of Zimbabweans and household income with householder between the ages 25 and 44 in the United States with a correlation coefficient (R) of 0.162 and weighted average of $98,586. Similarly, the statistical analysis conducted on geographies consisting of 29,750,009 people shows a poor negative correlation between the proportion of Arapaho and household income with householder between the ages 25 and 44 in the United States with a correlation coefficient (R) of -0.151 and weighted average of $71,697, a difference of 37.5%.
Householder Income Ages 25 - 44 years Correlation Summary
| Measurement | Zimbabwean | Arapaho |
| Minimum | $38,611 | $30,478 |
| Maximum | $194,972 | $113,036 |
| Range | $156,361 | $82,558 |
| Mean | $108,063 | $63,768 |
| Median | $102,697 | $62,022 |
| Interquartile 25% (IQ1) | $79,354 | $52,738 |
| Interquartile 75% (IQ3) | $125,334 | $69,428 |
| Interquartile Range (IQR) | $45,980 | $16,690 |
| Standard Deviation (Sample) | $34,623 | $18,151 |
| Standard Deviation (Population) | $34,261 | $17,692 |
Similar Demographics by Householder Income Ages 25 - 44 years
Demographics Similar to Zimbabweans by Householder Income Ages 25 - 44 years
In terms of householder income ages 25 - 44 years, the demographic groups most similar to Zimbabweans are Palestinian ($98,777, a difference of 0.19%), Pakistani ($98,401, a difference of 0.19%), British ($98,359, a difference of 0.23%), Immigrants from Uzbekistan ($98,849, a difference of 0.27%), and Serbian ($98,320, a difference of 0.27%).
| Demographics | Rating | Rank | Householder Income Ages 25 - 44 years |
| Immigrants | Northern Africa | 93.0 /100 | #117 | Exceptional $99,232 |
| Syrians | 92.9 /100 | #118 | Exceptional $99,215 |
| Jordanians | 92.8 /100 | #119 | Exceptional $99,186 |
| Swedes | 92.7 /100 | #120 | Exceptional $99,136 |
| Peruvians | 91.7 /100 | #121 | Exceptional $98,886 |
| Immigrants | Uzbekistan | 91.5 /100 | #122 | Exceptional $98,849 |
| Palestinians | 91.2 /100 | #123 | Exceptional $98,777 |
| Zimbabweans | 90.3 /100 | #124 | Exceptional $98,586 |
| Pakistanis | 89.3 /100 | #125 | Excellent $98,401 |
| British | 89.1 /100 | #126 | Excellent $98,359 |
| Serbians | 88.9 /100 | #127 | Excellent $98,320 |
| Europeans | 88.9 /100 | #128 | Excellent $98,310 |
| Brazilians | 88.6 /100 | #129 | Excellent $98,267 |
| Immigrants | Kuwait | 87.8 /100 | #130 | Excellent $98,122 |
| Immigrants | Albania | 86.6 /100 | #131 | Excellent $97,929 |
Demographics Similar to Arapaho by Householder Income Ages 25 - 44 years
In terms of householder income ages 25 - 44 years, the demographic groups most similar to Arapaho are Crow ($71,337, a difference of 0.50%), Immigrants from Congo ($72,178, a difference of 0.67%), Yuman ($72,956, a difference of 1.8%), Immigrants from Yemen ($73,043, a difference of 1.9%), and Black/African American ($73,370, a difference of 2.3%).
| Demographics | Rating | Rank | Householder Income Ages 25 - 44 years |
| Hopi | 0.0 /100 | #333 | Tragic $75,002 |
| Creek | 0.0 /100 | #334 | Tragic $74,847 |
| Kiowa | 0.0 /100 | #335 | Tragic $74,776 |
| Yup'ik | 0.0 /100 | #336 | Tragic $73,688 |
| Blacks/African Americans | 0.0 /100 | #337 | Tragic $73,370 |
| Immigrants | Yemen | 0.0 /100 | #338 | Tragic $73,043 |
| Yuman | 0.0 /100 | #339 | Tragic $72,956 |
| Immigrants | Congo | 0.0 /100 | #340 | Tragic $72,178 |
| Arapaho | 0.0 /100 | #341 | Tragic $71,697 |
| Crow | 0.0 /100 | #342 | Tragic $71,337 |
| Tohono O'odham | 0.0 /100 | #343 | Tragic $69,068 |
| Pueblo | 0.0 /100 | #344 | Tragic $68,910 |
| Navajo | 0.0 /100 | #345 | Tragic $66,529 |
| Puerto Ricans | 0.0 /100 | #346 | Tragic $65,996 |
| Lumbee | 0.0 /100 | #347 | Tragic $60,305 |