Aleut vs Arapaho Householder Income Ages 25 - 44 years
COMPARE
Aleut
Arapaho
Householder Income Ages 25 - 44 years
Householder Income Ages 25 - 44 years Comparison
Aleuts
Arapaho
$91,370
HOUSEHOLDER INCOME AGES 25 - 44 YEARS
14.5/ 100
METRIC RATING
206th/ 347
METRIC RANK
$71,697
HOUSEHOLDER INCOME AGES 25 - 44 YEARS
0.0/ 100
METRIC RATING
341st/ 347
METRIC RANK
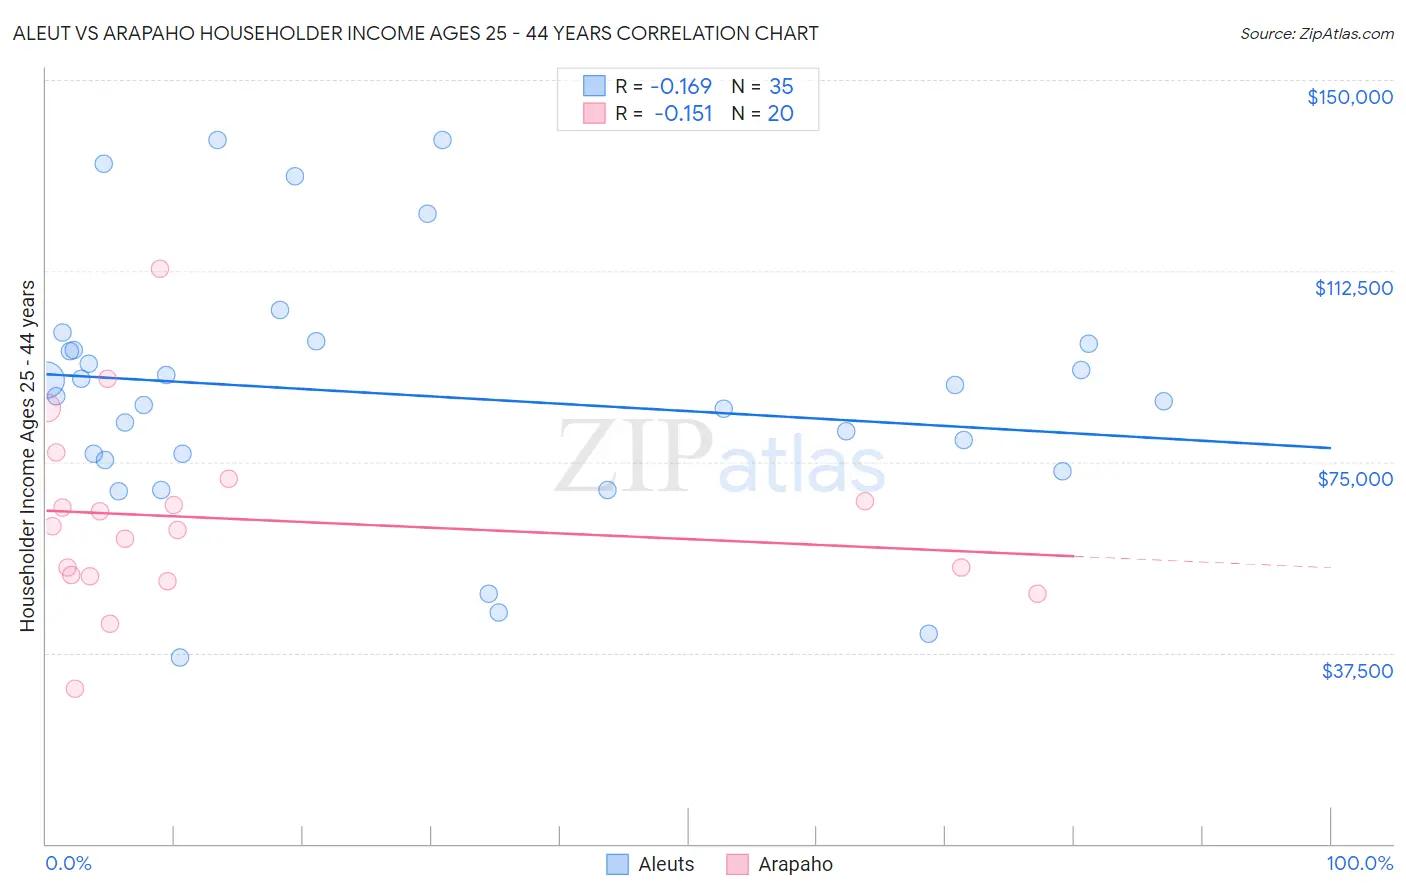
Aleut vs Arapaho Householder Income Ages 25 - 44 years Correlation Chart
The statistical analysis conducted on geographies consisting of 61,739,915 people shows a poor negative correlation between the proportion of Aleuts and household income with householder between the ages 25 and 44 in the United States with a correlation coefficient (R) of -0.169 and weighted average of $91,370. Similarly, the statistical analysis conducted on geographies consisting of 29,750,009 people shows a poor negative correlation between the proportion of Arapaho and household income with householder between the ages 25 and 44 in the United States with a correlation coefficient (R) of -0.151 and weighted average of $71,697, a difference of 27.4%.
Householder Income Ages 25 - 44 years Correlation Summary
| Measurement | Aleut | Arapaho |
| Minimum | $36,667 | $30,478 |
| Maximum | $138,313 | $113,036 |
| Range | $101,646 | $82,558 |
| Mean | $88,134 | $63,768 |
| Median | $88,006 | $62,022 |
| Interquartile 25% (IQ1) | $75,410 | $52,738 |
| Interquartile 75% (IQ3) | $98,125 | $69,428 |
| Interquartile Range (IQR) | $22,715 | $16,690 |
| Standard Deviation (Sample) | $24,944 | $18,151 |
| Standard Deviation (Population) | $24,585 | $17,692 |
Similar Demographics by Householder Income Ages 25 - 44 years
Demographics Similar to Aleuts by Householder Income Ages 25 - 44 years
In terms of householder income ages 25 - 44 years, the demographic groups most similar to Aleuts are Yugoslavian ($91,368, a difference of 0.0%), Immigrants from Thailand ($91,337, a difference of 0.040%), Immigrants from Eastern Africa ($91,458, a difference of 0.10%), Nepalese ($91,498, a difference of 0.14%), and Immigrants from Cambodia ($91,533, a difference of 0.18%).
| Demographics | Rating | Rank | Householder Income Ages 25 - 44 years |
| Kenyans | 16.8 /100 | #199 | Poor $91,684 |
| Whites/Caucasians | 16.7 /100 | #200 | Poor $91,668 |
| Japanese | 16.4 /100 | #201 | Poor $91,624 |
| Ecuadorians | 16.0 /100 | #202 | Poor $91,574 |
| Immigrants | Cambodia | 15.7 /100 | #203 | Poor $91,533 |
| Nepalese | 15.4 /100 | #204 | Poor $91,498 |
| Immigrants | Eastern Africa | 15.2 /100 | #205 | Poor $91,458 |
| Aleuts | 14.5 /100 | #206 | Poor $91,370 |
| Yugoslavians | 14.5 /100 | #207 | Poor $91,368 |
| Immigrants | Thailand | 14.3 /100 | #208 | Poor $91,337 |
| Immigrants | Uruguay | 13.2 /100 | #209 | Poor $91,171 |
| Immigrants | Kenya | 10.9 /100 | #210 | Poor $90,767 |
| Iraqis | 10.8 /100 | #211 | Poor $90,764 |
| Hawaiians | 10.6 /100 | #212 | Poor $90,722 |
| Immigrants | Bangladesh | 9.3 /100 | #213 | Tragic $90,448 |
Demographics Similar to Arapaho by Householder Income Ages 25 - 44 years
In terms of householder income ages 25 - 44 years, the demographic groups most similar to Arapaho are Crow ($71,337, a difference of 0.50%), Immigrants from Congo ($72,178, a difference of 0.67%), Yuman ($72,956, a difference of 1.8%), Immigrants from Yemen ($73,043, a difference of 1.9%), and Black/African American ($73,370, a difference of 2.3%).
| Demographics | Rating | Rank | Householder Income Ages 25 - 44 years |
| Hopi | 0.0 /100 | #333 | Tragic $75,002 |
| Creek | 0.0 /100 | #334 | Tragic $74,847 |
| Kiowa | 0.0 /100 | #335 | Tragic $74,776 |
| Yup'ik | 0.0 /100 | #336 | Tragic $73,688 |
| Blacks/African Americans | 0.0 /100 | #337 | Tragic $73,370 |
| Immigrants | Yemen | 0.0 /100 | #338 | Tragic $73,043 |
| Yuman | 0.0 /100 | #339 | Tragic $72,956 |
| Immigrants | Congo | 0.0 /100 | #340 | Tragic $72,178 |
| Arapaho | 0.0 /100 | #341 | Tragic $71,697 |
| Crow | 0.0 /100 | #342 | Tragic $71,337 |
| Tohono O'odham | 0.0 /100 | #343 | Tragic $69,068 |
| Pueblo | 0.0 /100 | #344 | Tragic $68,910 |
| Navajo | 0.0 /100 | #345 | Tragic $66,529 |
| Puerto Ricans | 0.0 /100 | #346 | Tragic $65,996 |
| Lumbee | 0.0 /100 | #347 | Tragic $60,305 |