Immigrants from Czechoslovakia vs Arapaho Householder Income Ages 25 - 44 years
COMPARE
Immigrants from Czechoslovakia
Arapaho
Householder Income Ages 25 - 44 years
Householder Income Ages 25 - 44 years Comparison
Immigrants from Czechoslovakia
Arapaho
$106,888
HOUSEHOLDER INCOME AGES 25 - 44 YEARS
99.9/ 100
METRIC RATING
51st/ 347
METRIC RANK
$71,697
HOUSEHOLDER INCOME AGES 25 - 44 YEARS
0.0/ 100
METRIC RATING
341st/ 347
METRIC RANK
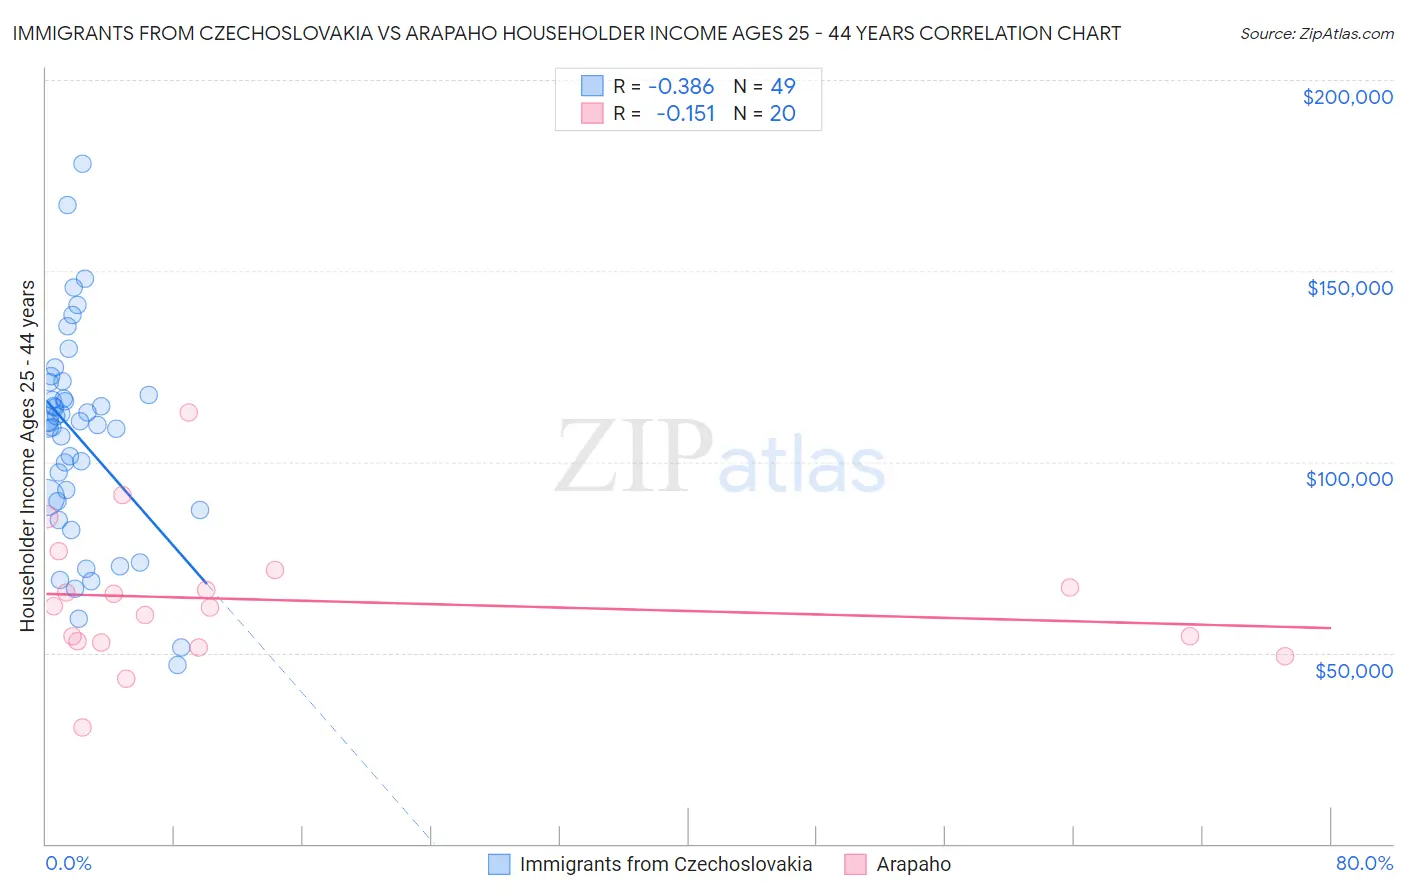
Immigrants from Czechoslovakia vs Arapaho Householder Income Ages 25 - 44 years Correlation Chart
The statistical analysis conducted on geographies consisting of 195,143,251 people shows a mild negative correlation between the proportion of Immigrants from Czechoslovakia and household income with householder between the ages 25 and 44 in the United States with a correlation coefficient (R) of -0.386 and weighted average of $106,888. Similarly, the statistical analysis conducted on geographies consisting of 29,750,009 people shows a poor negative correlation between the proportion of Arapaho and household income with householder between the ages 25 and 44 in the United States with a correlation coefficient (R) of -0.151 and weighted average of $71,697, a difference of 49.1%.
Householder Income Ages 25 - 44 years Correlation Summary
| Measurement | Immigrants from Czechoslovakia | Arapaho |
| Minimum | $46,875 | $30,478 |
| Maximum | $178,200 | $113,036 |
| Range | $131,325 | $82,558 |
| Mean | $106,163 | $63,768 |
| Median | $110,384 | $62,022 |
| Interquartile 25% (IQ1) | $88,476 | $52,738 |
| Interquartile 75% (IQ3) | $119,204 | $69,428 |
| Interquartile Range (IQR) | $30,729 | $16,690 |
| Standard Deviation (Sample) | $27,581 | $18,151 |
| Standard Deviation (Population) | $27,298 | $17,692 |
Similar Demographics by Householder Income Ages 25 - 44 years
Demographics Similar to Immigrants from Czechoslovakia by Householder Income Ages 25 - 44 years
In terms of householder income ages 25 - 44 years, the demographic groups most similar to Immigrants from Czechoslovakia are Immigrants from Europe ($106,817, a difference of 0.070%), Cambodian ($107,148, a difference of 0.24%), Immigrants from Norway ($106,629, a difference of 0.24%), Paraguayan ($106,615, a difference of 0.26%), and Bulgarian ($107,264, a difference of 0.35%).
| Demographics | Rating | Rank | Householder Income Ages 25 - 44 years |
| Immigrants | Indonesia | 99.9 /100 | #44 | Exceptional $107,627 |
| Israelis | 99.9 /100 | #45 | Exceptional $107,579 |
| Immigrants | Belarus | 99.9 /100 | #46 | Exceptional $107,393 |
| Estonians | 99.9 /100 | #47 | Exceptional $107,269 |
| Bulgarians | 99.9 /100 | #48 | Exceptional $107,264 |
| Immigrants | Turkey | 99.9 /100 | #49 | Exceptional $107,258 |
| Cambodians | 99.9 /100 | #50 | Exceptional $107,148 |
| Immigrants | Czechoslovakia | 99.9 /100 | #51 | Exceptional $106,888 |
| Immigrants | Europe | 99.9 /100 | #52 | Exceptional $106,817 |
| Immigrants | Norway | 99.9 /100 | #53 | Exceptional $106,629 |
| Paraguayans | 99.9 /100 | #54 | Exceptional $106,615 |
| Greeks | 99.9 /100 | #55 | Exceptional $106,457 |
| Immigrants | Pakistan | 99.8 /100 | #56 | Exceptional $106,129 |
| Immigrants | Austria | 99.8 /100 | #57 | Exceptional $106,103 |
| Immigrants | South Africa | 99.8 /100 | #58 | Exceptional $105,748 |
Demographics Similar to Arapaho by Householder Income Ages 25 - 44 years
In terms of householder income ages 25 - 44 years, the demographic groups most similar to Arapaho are Crow ($71,337, a difference of 0.50%), Immigrants from Congo ($72,178, a difference of 0.67%), Yuman ($72,956, a difference of 1.8%), Immigrants from Yemen ($73,043, a difference of 1.9%), and Black/African American ($73,370, a difference of 2.3%).
| Demographics | Rating | Rank | Householder Income Ages 25 - 44 years |
| Hopi | 0.0 /100 | #333 | Tragic $75,002 |
| Creek | 0.0 /100 | #334 | Tragic $74,847 |
| Kiowa | 0.0 /100 | #335 | Tragic $74,776 |
| Yup'ik | 0.0 /100 | #336 | Tragic $73,688 |
| Blacks/African Americans | 0.0 /100 | #337 | Tragic $73,370 |
| Immigrants | Yemen | 0.0 /100 | #338 | Tragic $73,043 |
| Yuman | 0.0 /100 | #339 | Tragic $72,956 |
| Immigrants | Congo | 0.0 /100 | #340 | Tragic $72,178 |
| Arapaho | 0.0 /100 | #341 | Tragic $71,697 |
| Crow | 0.0 /100 | #342 | Tragic $71,337 |
| Tohono O'odham | 0.0 /100 | #343 | Tragic $69,068 |
| Pueblo | 0.0 /100 | #344 | Tragic $68,910 |
| Navajo | 0.0 /100 | #345 | Tragic $66,529 |
| Puerto Ricans | 0.0 /100 | #346 | Tragic $65,996 |
| Lumbee | 0.0 /100 | #347 | Tragic $60,305 |