Zimbabwean vs Immigrants from Thailand Householder Income Ages 25 - 44 years
COMPARE
Zimbabwean
Immigrants from Thailand
Householder Income Ages 25 - 44 years
Householder Income Ages 25 - 44 years Comparison
Zimbabweans
Immigrants from Thailand
$98,586
HOUSEHOLDER INCOME AGES 25 - 44 YEARS
90.3/ 100
METRIC RATING
124th/ 347
METRIC RANK
$91,337
HOUSEHOLDER INCOME AGES 25 - 44 YEARS
14.3/ 100
METRIC RATING
208th/ 347
METRIC RANK
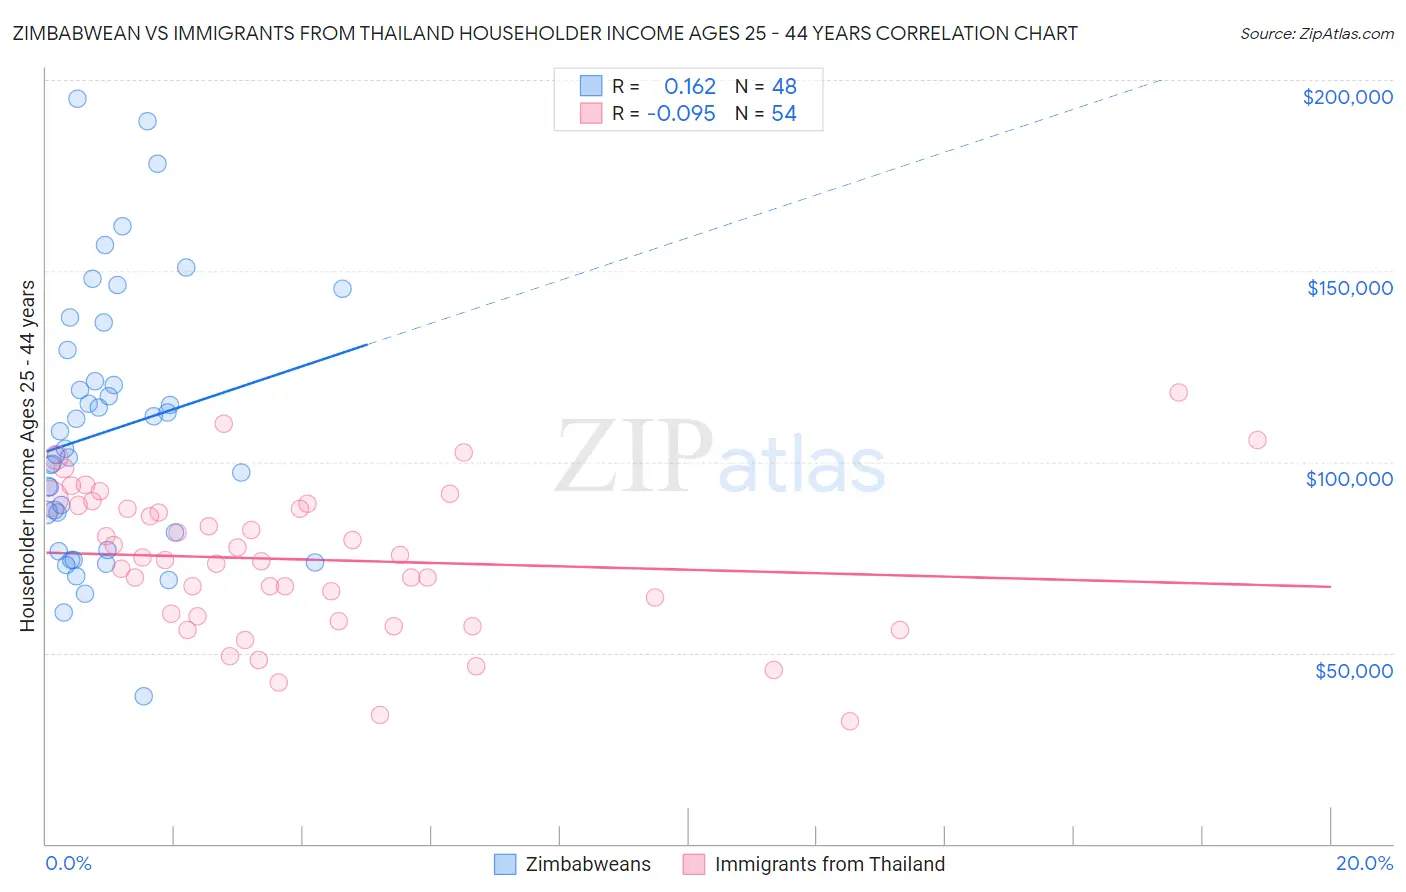
Zimbabwean vs Immigrants from Thailand Householder Income Ages 25 - 44 years Correlation Chart
The statistical analysis conducted on geographies consisting of 69,182,537 people shows a poor positive correlation between the proportion of Zimbabweans and household income with householder between the ages 25 and 44 in the United States with a correlation coefficient (R) of 0.162 and weighted average of $98,586. Similarly, the statistical analysis conducted on geographies consisting of 316,454,000 people shows a slight negative correlation between the proportion of Immigrants from Thailand and household income with householder between the ages 25 and 44 in the United States with a correlation coefficient (R) of -0.095 and weighted average of $91,337, a difference of 7.9%.
Householder Income Ages 25 - 44 years Correlation Summary
| Measurement | Zimbabwean | Immigrants from Thailand |
| Minimum | $38,611 | $32,083 |
| Maximum | $194,972 | $118,125 |
| Range | $156,361 | $86,042 |
| Mean | $108,063 | $74,382 |
| Median | $102,697 | $74,631 |
| Interquartile 25% (IQ1) | $79,354 | $59,491 |
| Interquartile 75% (IQ3) | $125,334 | $88,604 |
| Interquartile Range (IQR) | $45,980 | $29,112 |
| Standard Deviation (Sample) | $34,623 | $19,277 |
| Standard Deviation (Population) | $34,261 | $19,098 |
Similar Demographics by Householder Income Ages 25 - 44 years
Demographics Similar to Zimbabweans by Householder Income Ages 25 - 44 years
In terms of householder income ages 25 - 44 years, the demographic groups most similar to Zimbabweans are Palestinian ($98,777, a difference of 0.19%), Pakistani ($98,401, a difference of 0.19%), British ($98,359, a difference of 0.23%), Immigrants from Uzbekistan ($98,849, a difference of 0.27%), and Serbian ($98,320, a difference of 0.27%).
| Demographics | Rating | Rank | Householder Income Ages 25 - 44 years |
| Immigrants | Northern Africa | 93.0 /100 | #117 | Exceptional $99,232 |
| Syrians | 92.9 /100 | #118 | Exceptional $99,215 |
| Jordanians | 92.8 /100 | #119 | Exceptional $99,186 |
| Swedes | 92.7 /100 | #120 | Exceptional $99,136 |
| Peruvians | 91.7 /100 | #121 | Exceptional $98,886 |
| Immigrants | Uzbekistan | 91.5 /100 | #122 | Exceptional $98,849 |
| Palestinians | 91.2 /100 | #123 | Exceptional $98,777 |
| Zimbabweans | 90.3 /100 | #124 | Exceptional $98,586 |
| Pakistanis | 89.3 /100 | #125 | Excellent $98,401 |
| British | 89.1 /100 | #126 | Excellent $98,359 |
| Serbians | 88.9 /100 | #127 | Excellent $98,320 |
| Europeans | 88.9 /100 | #128 | Excellent $98,310 |
| Brazilians | 88.6 /100 | #129 | Excellent $98,267 |
| Immigrants | Kuwait | 87.8 /100 | #130 | Excellent $98,122 |
| Immigrants | Albania | 86.6 /100 | #131 | Excellent $97,929 |
Demographics Similar to Immigrants from Thailand by Householder Income Ages 25 - 44 years
In terms of householder income ages 25 - 44 years, the demographic groups most similar to Immigrants from Thailand are Yugoslavian ($91,368, a difference of 0.030%), Aleut ($91,370, a difference of 0.040%), Immigrants from Eastern Africa ($91,458, a difference of 0.13%), Nepalese ($91,498, a difference of 0.18%), and Immigrants from Uruguay ($91,171, a difference of 0.18%).
| Demographics | Rating | Rank | Householder Income Ages 25 - 44 years |
| Japanese | 16.4 /100 | #201 | Poor $91,624 |
| Ecuadorians | 16.0 /100 | #202 | Poor $91,574 |
| Immigrants | Cambodia | 15.7 /100 | #203 | Poor $91,533 |
| Nepalese | 15.4 /100 | #204 | Poor $91,498 |
| Immigrants | Eastern Africa | 15.2 /100 | #205 | Poor $91,458 |
| Aleuts | 14.5 /100 | #206 | Poor $91,370 |
| Yugoslavians | 14.5 /100 | #207 | Poor $91,368 |
| Immigrants | Thailand | 14.3 /100 | #208 | Poor $91,337 |
| Immigrants | Uruguay | 13.2 /100 | #209 | Poor $91,171 |
| Immigrants | Kenya | 10.9 /100 | #210 | Poor $90,767 |
| Iraqis | 10.8 /100 | #211 | Poor $90,764 |
| Hawaiians | 10.6 /100 | #212 | Poor $90,722 |
| Immigrants | Bangladesh | 9.3 /100 | #213 | Tragic $90,448 |
| Immigrants | Africa | 8.9 /100 | #214 | Tragic $90,372 |
| Panamanians | 8.1 /100 | #215 | Tragic $90,193 |