Zimbabwean vs South American Householder Income Ages 25 - 44 years
COMPARE
Zimbabwean
South American
Householder Income Ages 25 - 44 years
Householder Income Ages 25 - 44 years Comparison
Zimbabweans
South Americans
$98,586
HOUSEHOLDER INCOME AGES 25 - 44 YEARS
90.3/ 100
METRIC RATING
124th/ 347
METRIC RANK
$95,362
HOUSEHOLDER INCOME AGES 25 - 44 YEARS
60.9/ 100
METRIC RATING
164th/ 347
METRIC RANK
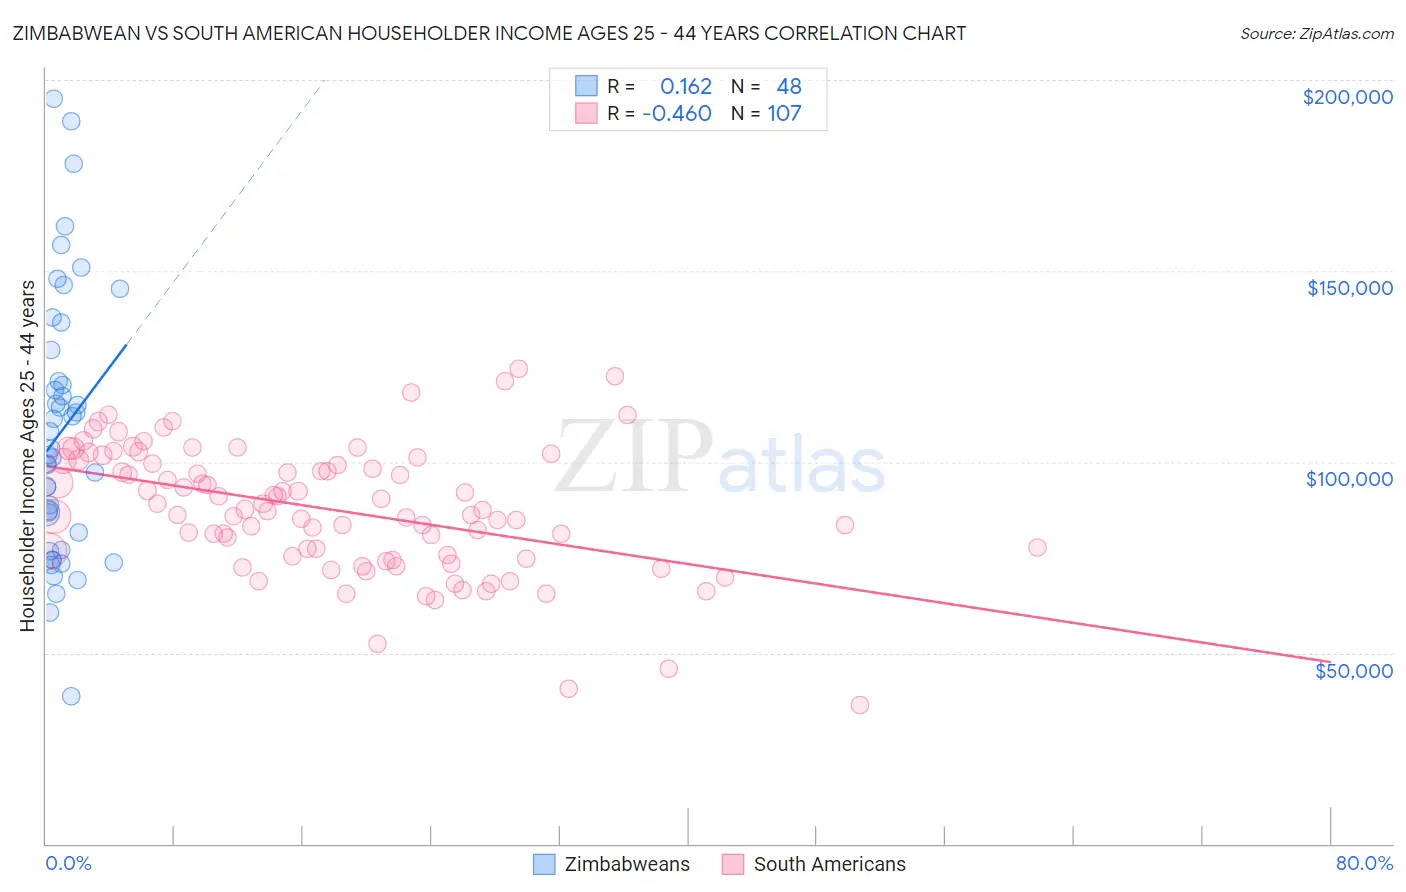
Zimbabwean vs South American Householder Income Ages 25 - 44 years Correlation Chart
The statistical analysis conducted on geographies consisting of 69,182,537 people shows a poor positive correlation between the proportion of Zimbabweans and household income with householder between the ages 25 and 44 in the United States with a correlation coefficient (R) of 0.162 and weighted average of $98,586. Similarly, the statistical analysis conducted on geographies consisting of 492,106,064 people shows a moderate negative correlation between the proportion of South Americans and household income with householder between the ages 25 and 44 in the United States with a correlation coefficient (R) of -0.460 and weighted average of $95,362, a difference of 3.4%.
Householder Income Ages 25 - 44 years Correlation Summary
| Measurement | Zimbabwean | South American |
| Minimum | $38,611 | $36,176 |
| Maximum | $194,972 | $124,375 |
| Range | $156,361 | $88,199 |
| Mean | $108,063 | $87,458 |
| Median | $102,697 | $87,265 |
| Interquartile 25% (IQ1) | $79,354 | $75,189 |
| Interquartile 75% (IQ3) | $125,334 | $100,291 |
| Interquartile Range (IQR) | $45,980 | $25,102 |
| Standard Deviation (Sample) | $34,623 | $16,777 |
| Standard Deviation (Population) | $34,261 | $16,698 |
Similar Demographics by Householder Income Ages 25 - 44 years
Demographics Similar to Zimbabweans by Householder Income Ages 25 - 44 years
In terms of householder income ages 25 - 44 years, the demographic groups most similar to Zimbabweans are Palestinian ($98,777, a difference of 0.19%), Pakistani ($98,401, a difference of 0.19%), British ($98,359, a difference of 0.23%), Immigrants from Uzbekistan ($98,849, a difference of 0.27%), and Serbian ($98,320, a difference of 0.27%).
| Demographics | Rating | Rank | Householder Income Ages 25 - 44 years |
| Immigrants | Northern Africa | 93.0 /100 | #117 | Exceptional $99,232 |
| Syrians | 92.9 /100 | #118 | Exceptional $99,215 |
| Jordanians | 92.8 /100 | #119 | Exceptional $99,186 |
| Swedes | 92.7 /100 | #120 | Exceptional $99,136 |
| Peruvians | 91.7 /100 | #121 | Exceptional $98,886 |
| Immigrants | Uzbekistan | 91.5 /100 | #122 | Exceptional $98,849 |
| Palestinians | 91.2 /100 | #123 | Exceptional $98,777 |
| Zimbabweans | 90.3 /100 | #124 | Exceptional $98,586 |
| Pakistanis | 89.3 /100 | #125 | Excellent $98,401 |
| British | 89.1 /100 | #126 | Excellent $98,359 |
| Serbians | 88.9 /100 | #127 | Excellent $98,320 |
| Europeans | 88.9 /100 | #128 | Excellent $98,310 |
| Brazilians | 88.6 /100 | #129 | Excellent $98,267 |
| Immigrants | Kuwait | 87.8 /100 | #130 | Excellent $98,122 |
| Immigrants | Albania | 86.6 /100 | #131 | Excellent $97,929 |
Demographics Similar to South Americans by Householder Income Ages 25 - 44 years
In terms of householder income ages 25 - 44 years, the demographic groups most similar to South Americans are Immigrants from Nepal ($95,322, a difference of 0.040%), Immigrants from Saudi Arabia ($95,450, a difference of 0.090%), Immigrants from Ethiopia ($95,256, a difference of 0.11%), Immigrants from Portugal ($95,512, a difference of 0.16%), and Swiss ($95,511, a difference of 0.16%).
| Demographics | Rating | Rank | Householder Income Ages 25 - 44 years |
| Immigrants | Uganda | 65.2 /100 | #157 | Good $95,698 |
| Scandinavians | 63.9 /100 | #158 | Good $95,596 |
| Costa Ricans | 63.5 /100 | #159 | Good $95,565 |
| Icelanders | 63.4 /100 | #160 | Good $95,560 |
| Immigrants | Portugal | 62.8 /100 | #161 | Good $95,512 |
| Swiss | 62.8 /100 | #162 | Good $95,511 |
| Immigrants | Saudi Arabia | 62.0 /100 | #163 | Good $95,450 |
| South Americans | 60.9 /100 | #164 | Good $95,362 |
| Immigrants | Nepal | 60.3 /100 | #165 | Good $95,322 |
| Immigrants | Ethiopia | 59.5 /100 | #166 | Average $95,256 |
| Czechoslovakians | 57.0 /100 | #167 | Average $95,070 |
| Alsatians | 56.8 /100 | #168 | Average $95,059 |
| Native Hawaiians | 56.8 /100 | #169 | Average $95,058 |
| Slovaks | 56.4 /100 | #170 | Average $95,032 |
| Immigrants | Armenia | 54.2 /100 | #171 | Average $94,867 |